
netshoot
Pod can't reach a service by name, or DNS lookups are slow/timing out.
Automatically checked · GitHub checked 2026-11-14
Overview
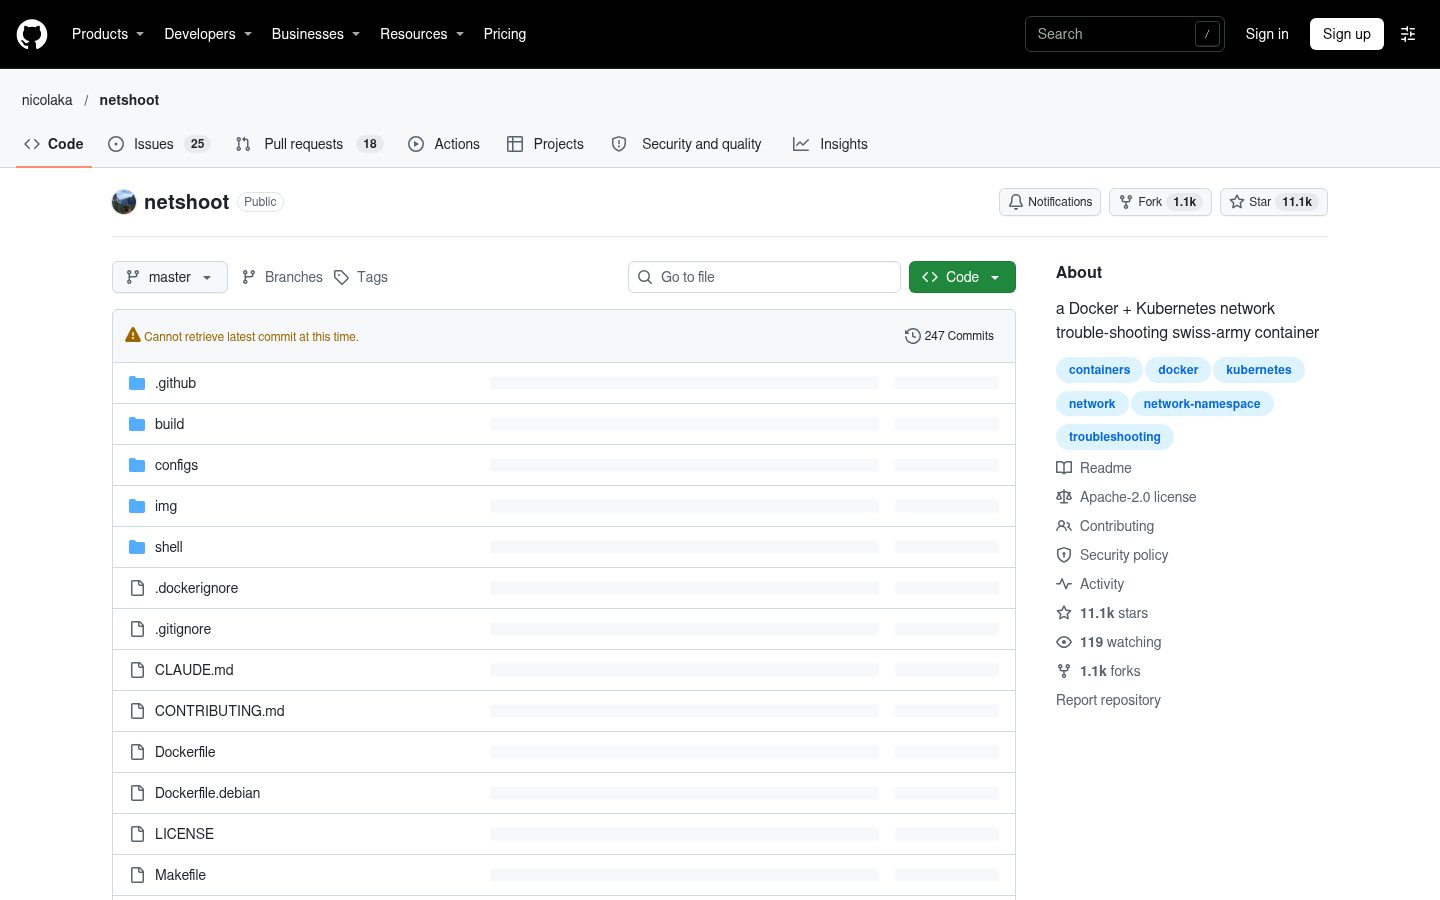
netshoot: a Docker + Kubernetes network trouble-shooting swiss-army container

Quick Start
# Share a running container's network namespace
docker run -it --net container:<container_name> nicolaka/netshoot

# Use the host's network namespace
docker run -it --net host nicolaka/netshoot

# Ephemeral debug container in Kubernetes
kubectl debug <pod> -it --image=nicolaka/netshoot

# Prefer a digest in production debug sessions
docker run -it --rm nicolaka/netshoot@sha256:<digest>
Why netshoot
Docker and Kubernetes isolate every container in its own network namespace — its own interfaces, routes, and IP stack. netshoot exploits the fact that you can enter any namespace without modifying what's running inside it.
- Debug a container without installing tools into its image
- Debug a host without installing anything on it
- Debug in Kubernetes as an ephemeral container, throwaway pod, or sidecar
Launch Options
Docker
# Enter a specific container's namespace
docker run -it --net container:<container_name> nicolaka/netshoot

# Enter the host's namespace
docker run -it --net host nicolaka/netshoot

# Enter a Docker bridge network's namespace via nsenter
docker run -it --rm \
  -v /var/run/docker/netns:/var/run/docker/netns \
  --privileged \
  nicolaka/netshoot
# then: nsenter --net=/var/run/docker/netns/<id> sh
Docker Compose
See configs/netshoot-compose.yaml for a Compose file that shares another service's network namespace and writes a pcap:
docker compose -f configs/netshoot-compose.yaml up
Kubernetes
# Ephemeral container in a running pod (non-destructive)
kubectl debug <pod> -it --image=nicolaka/netshoot

# Throwaway pod
kubectl run tmp-shell --rm -i --tty --image nicolaka/netshoot

# Throwaway pod on the host's network namespace
kubectl run tmp-shell --rm -i --tty \
  --overrides='{"spec": {"hostNetwork": true}}' \
  --image nicolaka/netshoot

# Sidecar in a Deployment
kubectl apply -f configs/netshoot-sidecar.yaml
kubectl exec -it <pod> -c netshoot -- zsh
kubectl plugin
The kubectl-netshoot plugin wraps the above into ergonomic subcommands:
kubectl netshoot run tmp-shell          # throwaway pod
kubectl netshoot debug my-pod           # ephemeral container
kubectl netshoot debug node/my-node     # node debug session
Troubleshooting Scenarios
DNS resolution failures
Pod can't reach a service by name, or DNS lookups are slow/timing out.
# 1. Check what DNS server the container is using
cat /etc/resolv.conf

# 2. Resolve a Kubernetes service name
drill kubernetes.default.svc.cluster.local

# 3. Query the cluster DNS directly (bypass resolv.conf)
drill @10.96.0.10 kubernetes.default.svc.cluster.local

# 4. Capture DNS traffic to see what's actually going over the wire
tcpdump -i eth0 -n port 53

# 5. Check for NXDOMAIN vs timeout — different root causes
drill -V 5 my-service.my-namespace.svc.cluster.local
Latency, packet loss, and throughput
Intermittent timeouts, high p99, or slow transfers between pods or nodes.
# Visual traceroute with latency per hop
mtr --report --report-cycles 10 <destination>

# Or use trippy for an interactive TUI traceroute
trip <destination>

# Measure raw TCP throughput between two pods:
# On pod A (server):
iperf3 -s

# On pod B (client):
iperf3 -c <pod-A-ip> -t 30

# Measure UDP throughput and jitter
iperf3 -c <pod-A-ip> -u -b 1G
Service reachability and firewall rules
Can pod A reach pod B on port X? Is something blocking traffic?
# Quick TCP connectivity check
nc -vz <host> <port>

# Scan a port range across a host
nmap -p 8080-8090 <host>

# Trace the full TCP path to a port (combines traceroute + TCP)
tcptraceroute <host> <port>

# Send a single TCP/UDP packet with custom payload
nping --tcp -p 443 <host>

# Check active connections and listening ports
ss -tulnp
Packet capture and deep inspection
Need to see the actual bytes — wrong headers, unexpected resets, TLS issues.
# Capture traffic on eth0 to a file
tcpdump -i eth0 -w /tmp/capture.pcap

# Live capture filtered by host and port
tcpdump -i eth0 -nn host <ip> and port 80

# Grep for a string in live traffic (e.g. HTTP Host headers)
ngrep -q -W byline "Host:" port 80

# Interactive TUI for live capture or reading a pcap
termshark -i eth0
termshark -r /tmp/capture.pcap

# Full protocol dissection with tshark
tshark -i eth0 -Y "http.request" -T fields -e http.host -e http.request.uri
gRPC and HTTP load testing
Validate a gRPC endpoint, hammer an HTTP service, check TLS.
# List gRPC services on a server
grpcurl <host>:<port> list

# Call a gRPC method
grpcurl -d '{"key":"value"}' <host>:<port> my.Service/Method

# Make an HTTP request with verbose output
http GET https://<host>/api/v1/items

# Load test: 100 QPS for 30s
fortio load -qps 100 -t 30s http://<host>/api/v1/items

# Check TLS certificate details
openssl s_client -connect <host>:443 </dev/null | openssl x509 -noout -text
Routing and ARP
Wrong route selected, ARP table stale, traffic going out the wrong interface.
# Show routing table
ip route show

# Show ARP/neighbour table
ip neigh show

# Trace which route a packet would take
ip route get <destination-ip>

# Show interface stats (drops, errors)
ip -s link show eth0

# Test ICMP reachability to multiple hosts at once
fping -a -g 10.0.0.1 10.0.0.254
SMTP testing
Validate mail relay, test TLS, confirm AUTH works.
swaks \
  --to [email protected] \
  --from [email protected] \
  --server mail.example.com:587 \
  --tls \
  --auth PLAIN \
  --auth-user [email protected] \
  --auth-password s3cr3t \
  --header "Subject: netshoot probe" \
  --body "SMTP connectivity test"
Container and network performance overview
# Top-like view of container CPU, memory, net, and I/O
docker run -it --rm \
  -v /var/run/docker.sock:/var/run/docker.sock \
  nicolaka/netshoot ctop
Included Tools
Network analysis
| Tool | Purpose |
|---|---|
tcpdump | Packet capture |
tshark | Protocol dissection |
termshark | TUI for tshark / pcap files |
ngrep | Grep over live network traffic |
wireshark (tshark) | Deep protocol analysis |
iftop | Bandwidth by host pair |
iptraf-ng | Real-time network stats |
netcat | TCP/UDP read/write |
socat | Multipurpose relay |
conntrack-tools | Connection tracking |
nftables | nftables ruleset inspection |
DNS
| Tool | Purpose |
|---|---|
drill | DNS query tool |
bind-tools | dig, nslookup, host |
Performance
| Tool | Purpose |
|---|---|
iperf / iperf3 | TCP/UDP throughput |
mtr | Traceroute + ping combined |
trippy | TUI traceroute |
fping | Parallel ICMP probing |
iputils | ping, arping |
speedtest-cli | Internet speed test |
ethtool | NIC settings and stats |
Security & scanning
| Tool | Purpose |
|---|---|
nmap | Port scanning |
nmap-nping | Packet crafting |
openssl | TLS inspection |
scapy | Python packet crafting |
dhcping | DHCP probe |
HTTP / gRPC / SMTP
| Tool | Purpose |
|---|---|
httpie | Human-friendly HTTP client |
curl | HTTP client |
grpcurl | gRPC client |
fortio | HTTP load testing |
websocat | WebSocket client |
swaks | SMTP testing |
apache2-utils | ab HTTP benchmarking |
Routing & interfaces
| Tool | Purpose |
|---|---|
iproute2 | ip route, ip link, ip neigh |
bridge-utils | Bridge management |
ipset | IP set management |
iptables | Firewall rules |
ipvsadm | IPVS table inspection |
tcptraceroute | Traceroute over TCP |
Containers
| Tool | Purpose |
|---|---|
ctop | Container metrics TUI |
Debug & tracing
| Tool | Purpose |
|---|---|
strace | Syscall tracing |
ltrace | Library call tracing |
net-snmp-tools | SNMP queries |
bird | BGP/OSPF routing daemon |
Images and platforms
Each release publishes two multi-arch images, both for linux/amd64 (x86_64) and linux/arm64 (aarch64). They are on Docker Hub as nicolaka/netshoot and on GHCR as ghcr.io/nicolaka/netshoot. linux/arm/v7, 386, ppc64le, s390x, and Windows are not built.
| Image | Base | libc | Dockerfile | Tags |
|---|---|---|---|---|
| Alpine (default) | Alpine 3.24 | musl | Dockerfile | :latest, :<version>, :<sha> |
docker pull nicolaka/netshoot:latest
| Image | Base | libc | Dockerfile | Tags |
|---|---|---|---|---|
| Debian | Debian 13 (trixie-slim) | glibc | Dockerfile.debian | :latest-debian, :<version>-debian, :<sha>-debian |
docker pull nicolaka/netshoot:latest-debian
The Alpine image installs packages from the 3.24 main and community repositories. trippy and swaks come from a tagged edge/testing repo. ctop, termshark, grpcurl, and fortio are pinned GitHub release binaries.
The Debian image is the same toolset built for glibc. Those four Go tools are compiled from source with the current Go toolchain instead of the old release binaries. Package names follow Debian (drill is in ldnsutils, nping is part of nmap, the image ships openssh-client and no sshd). The trippy binary is named trip.
Releases and pinning
Images are published when a v* git tag is pushed. :latest and :latest-debian track the newest tag.
This is a kitchen-sink debug image. For anything beyond a throwaway session, pin a digest rather than a floating tag. See SECURITY.md.
Contributing
See CONTRIBUTING.md.