
mac-performance-monitor
A diagnostic performance logging utility for macOS: logs CPU, memory, GPU, network, and battery from the menu bar to help detect and diagnose performance issues. Free, open source, no telemetry.
Automatically checked · GitHub checked 2026-11-16
Overview
Mac Performance Monitor














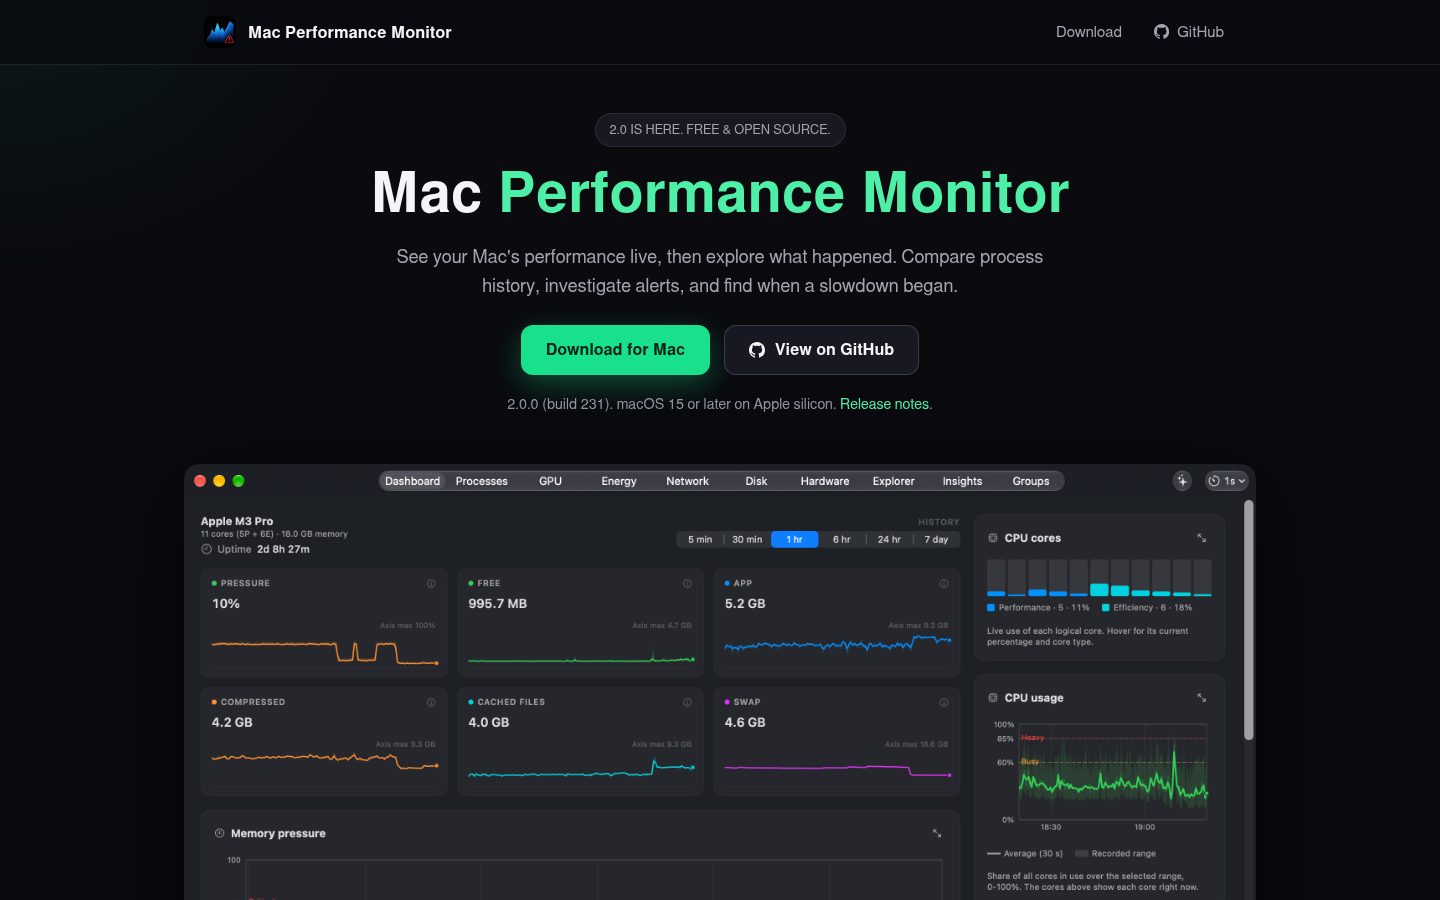
A native macOS performance monitor and recorder. See what your Mac is doing now, then go back to the moment a slowdown or spike began. Compare CPU, memory, GPU, network, disk, battery, and sensor readings with the processes behind them.
Use it as a live menu bar readout, a quiet background recorder, or a window you open when needed. The menu bar and history recorder have separate switches.
Free and open source. No usage telemetry. Recorded samples stay on your Mac.
2.8 release notes · Changelog · Documentation

New In 2.8
The Processes tab can now control and look inside a process, interpreters say what they are running, and the app warns you before the startup disk fills up.
-
Tell one Python from another: interpreters show what they are running, such as
python3 · train.py,node · tscoruv · train.py, wherever a process is named. Groups can match it with a Script or tool rule. Contributed by @georgeharker. -
Control a process: right-click to Quit, Suspend and Resume, change its Priority, or Force Quit it with everything it started. Threads shows which thread is busy.
-
Find who has it open: Processes > Find Open File or Port shows which process holds a file, a disk or a port. Click any window to select the process that owns it, and see what started each process.
-
Low disk space: an alert when the startup disk has less than 10% left (adjustable), and an optional Free Space read-out in the menu bar.
See the release notes for requirements and the changelog for every change.
Recent Releases
-
2.7: the GPU tab's Device panel shows the GPU's clock and what limits it, its work mix, memory limit and health. Update checks no longer open a window or take focus. Details
-
2.6: the Processes tab's Apps layout adds up each app's memory and CPU across all of its processes, including the helpers macOS starts for it. Russian joins the languages. A security review tightened the privileged helper, force quit and the uninstaller. Details
-
2.5: Hardware > Ports checks every USB-C, MagSafe, HDMI and SD port, including cable ratings and slow chargers. The Disk page leads with a card for each drive, the energy menu shows where the power comes from, and Explorer charts fill the window. Details
-
2.4: in menu-only tests, idle memory fell from about 160 MiB to about 70 MiB. The GPU tab is about half as tall. Details
Explorer: Investigate A Moment
Explorer is a workspace for live and recorded data. Pick a time, add the signals you need, and compare up to eight processes, including ones that have exited.
Hover to move a shared cursor across the charts. Click to pin a time. Hold Command and scroll to zoom around the pointer; ordinary scrolling still moves the page. Charts fill the window, or choose how many fit on screen.
The inspector shows source values, timestamps, known bounds, and stored machine rows. Export the visible data as CSV, or share process history in a trace file. Older data keeps its retained resolution; zooming does not invent detail. Hardware inventory is a current snapshot, separate from history.
Alerts Based On Change
High swap usage alone is not a reason to warn you. The rules look for continued growth or paging strain. They can report further worsening without first waiting for usage to fall below an old fixed limit.
Process-growth checks reject stale readings and growth that has settled. Modest findings stay as quiet observations, not a diagnosis of a memory leak. A separate fast-growth check can catch runaway use without waiting 20 minutes, and a program that keeps about a core busy for an hour is flagged too. A low disk space alert warns when the startup disk drops below 10% free (you choose the level), and the menu bar can show the space left.
Click the menu bar alert badge for active issues and their evidence. Snooze an ordinary alert for an hour, or open it in Explorer at the relevant time. Related memory alerts share a notice, and only critical notices request sound.
Adaptive alert rules and limits
Ask And AI Agents
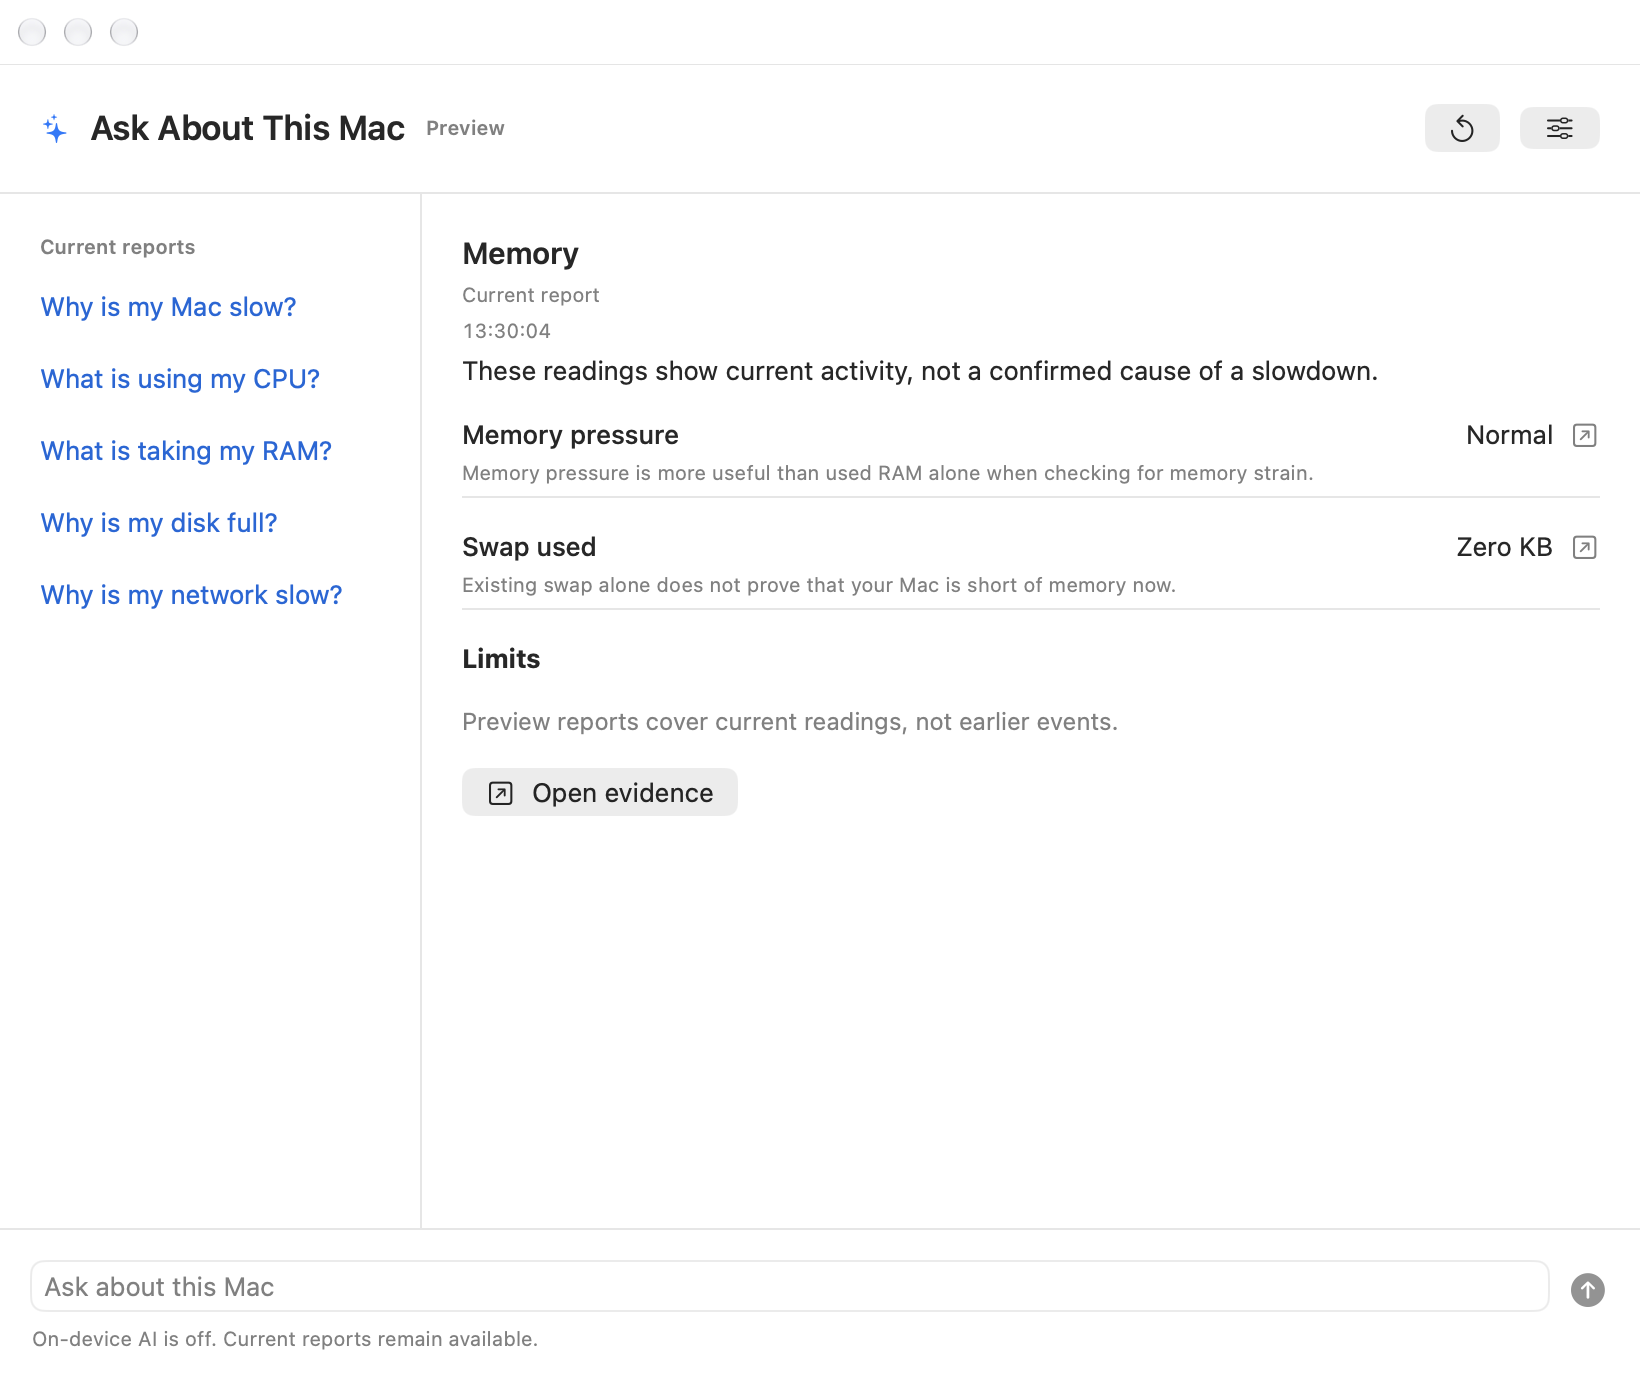
On macOS 27, Ask About This Mac opens with a one-line verdict and a status for each part of the Mac. Tap one, or ask a plain question such as "Why is my Mac slow?". The app checks its own readings and history, then Apple's on-device model explains them in everyday language, with links to the matching charts. Nothing leaves your Mac, and the area summaries work even when Apple Intelligence is off. Answers can still be wrong, so the facts behind each one are a click away.
Hand a harder question to Claude Code, Codex or another agent. Ask copies a prompt that explains the recorded history, or the one-line setup for the bundled read-only MCP server:
claude mcp add --scope user mac-performance-monitor -- "/Applications/Mac Performance Monitor.app/Contents/MacOS/mpm" mcp
Run mpm help for the command-line tool. The AI agents guide
covers Claude Code, Codex, Claude Desktop, Cursor and VS Code, what agents
can ask, and what leaves your Mac.
Battery History
All six Energy cards open larger charts and explanations. Health and Cycles show daily history over months and years, kept separate for each battery pack. Long-term history grows from new readings with recording on.
Runtime uses macOS estimates or recent steady use. A dashed forecast stays separate from real charge data. It assumes the same workload, not a fixed promise of how long the battery will last.
The Accessories panel shows the battery levels macOS reports for mice, keyboards, AirPods, and other devices. Optional low-battery alerts live in Settings > Alerts.
Upgrading From 1.x
Existing alert choices and history carry forward. The old swap threshold is no longer used, but explicit process-memory budgets remain available. New database fields preserve detail from new samples; they cannot restore missing older readings.
Back up the app's data before testing a downgrade. Review the upgrade notes and privacy policy before sharing trace files, reports, or screenshots.
Monitor Your Mac
-
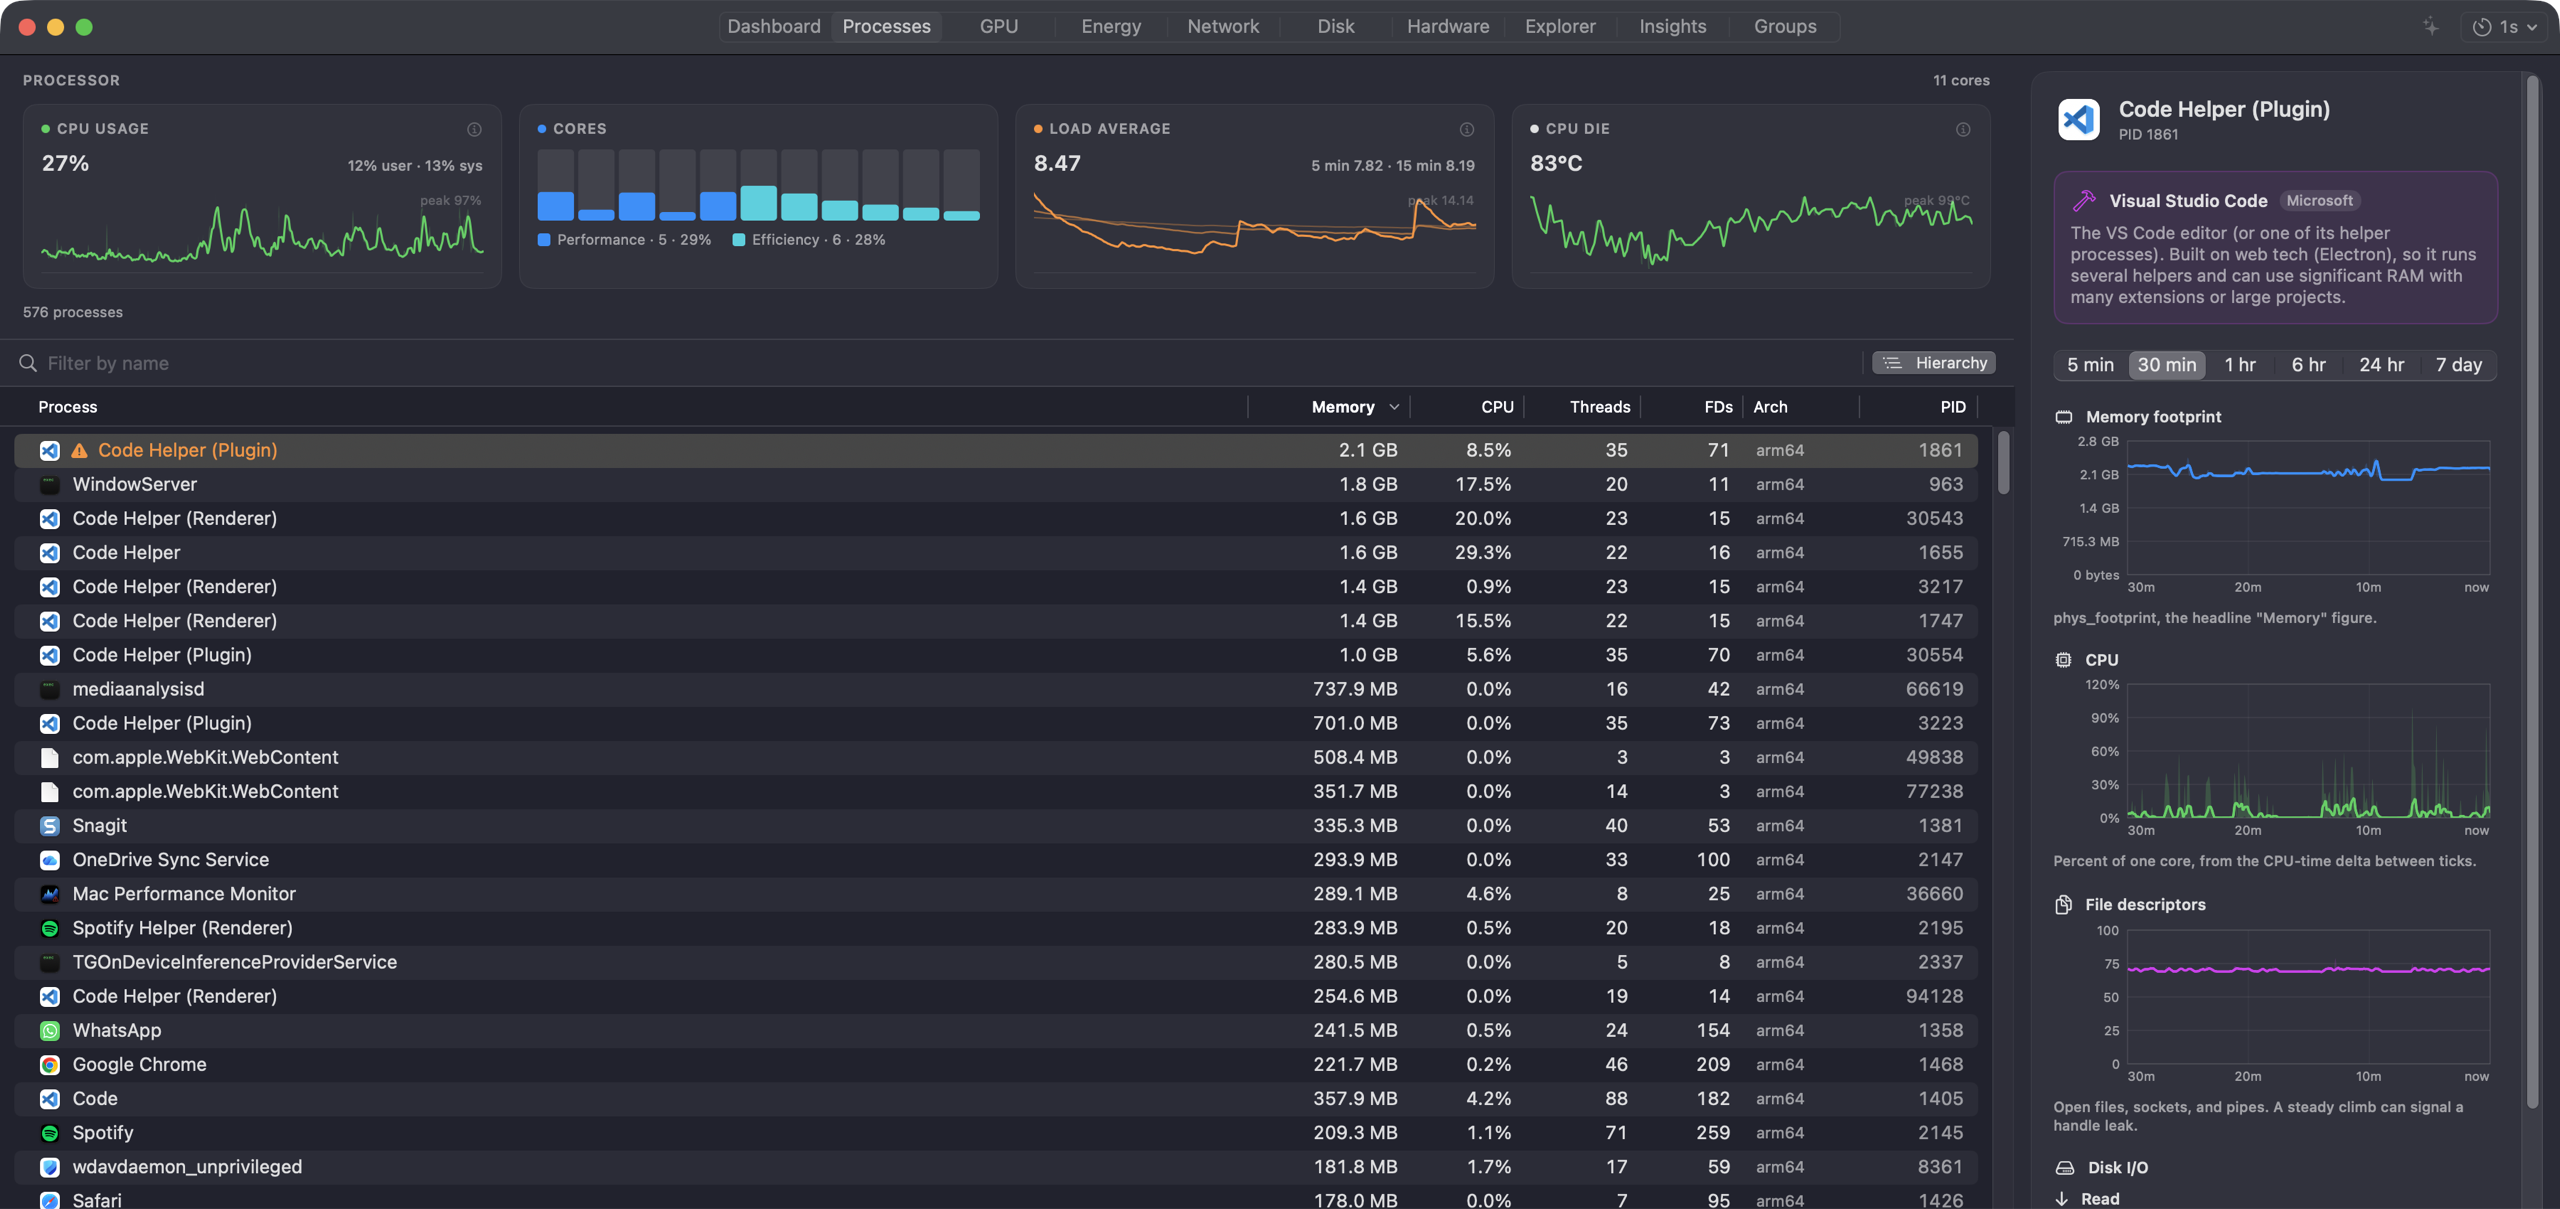
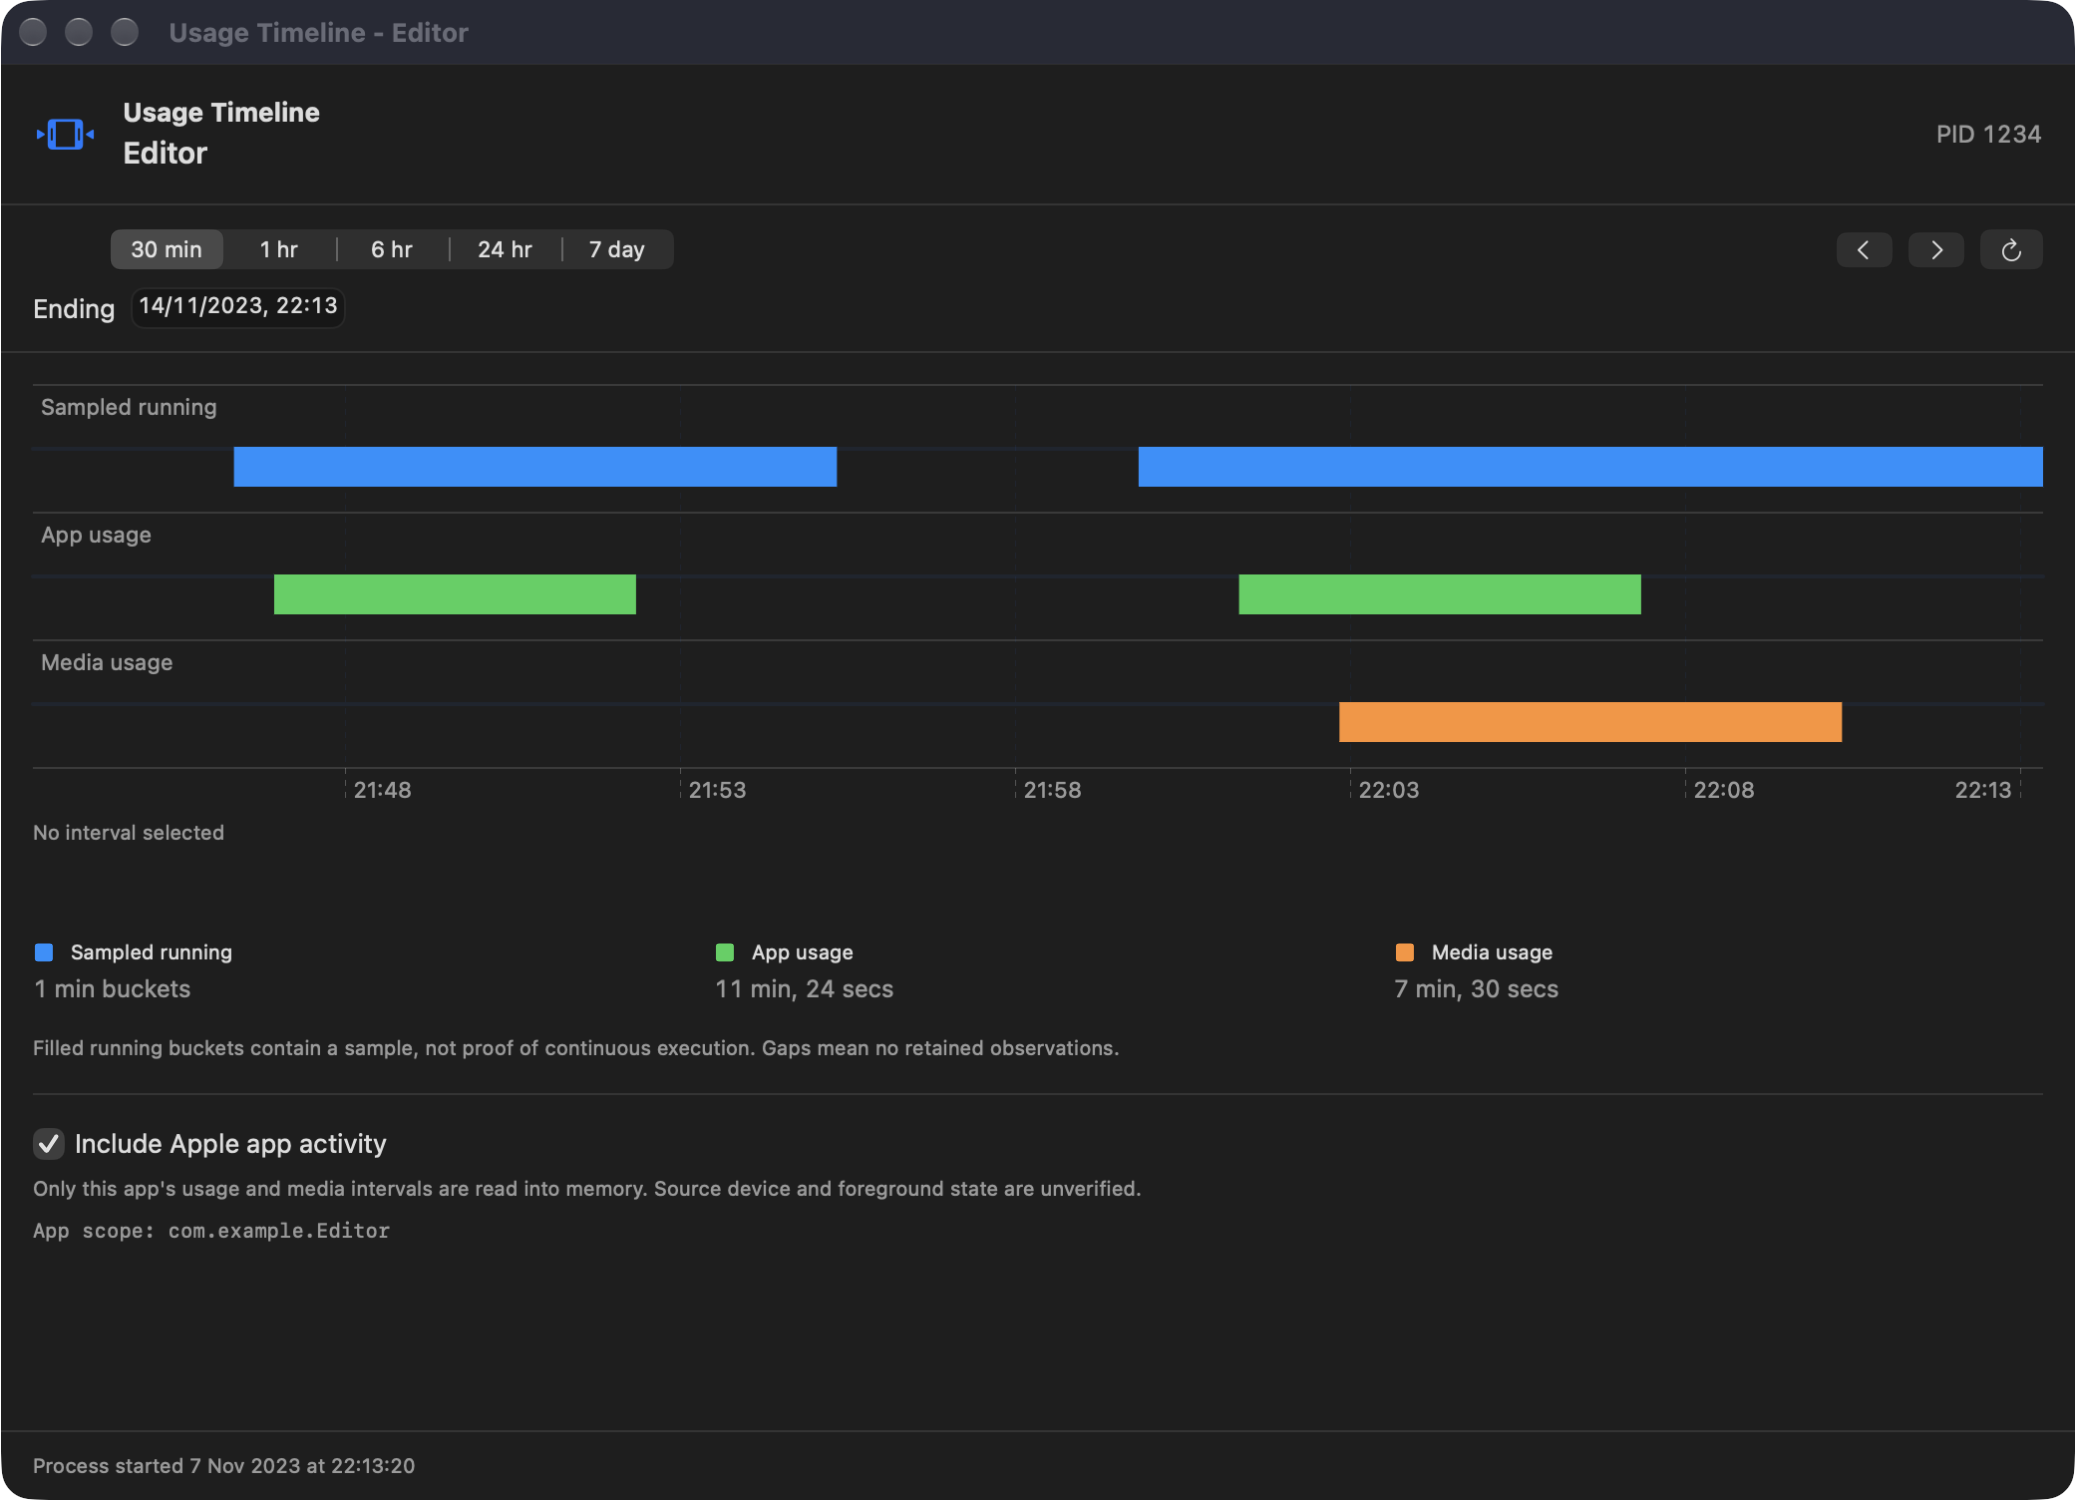
Processes: sort and filter the process table, inspect memory and CPU history, and check file descriptors, disk I/O, and Rosetta status. The Apps layout adds up each app's memory and CPU across all of its processes, including the helpers macOS starts for it. Interpreters show the script or tool they are running. Right-click a row to quit, suspend or reprioritize it, see its threads, or choose Usage Timeline for sampled running history. Find which process has a file or port open, or click a window to select its owner. Optional Apple app and media activity appears separately, with unverified device and foreground status. It requires Full Disk Access and a per-window opt-in; the app keeps these activity records in memory only.
-
Groups: collect related apps and helpers into a group and track their combined footprint as a share of the Mac's memory.
-
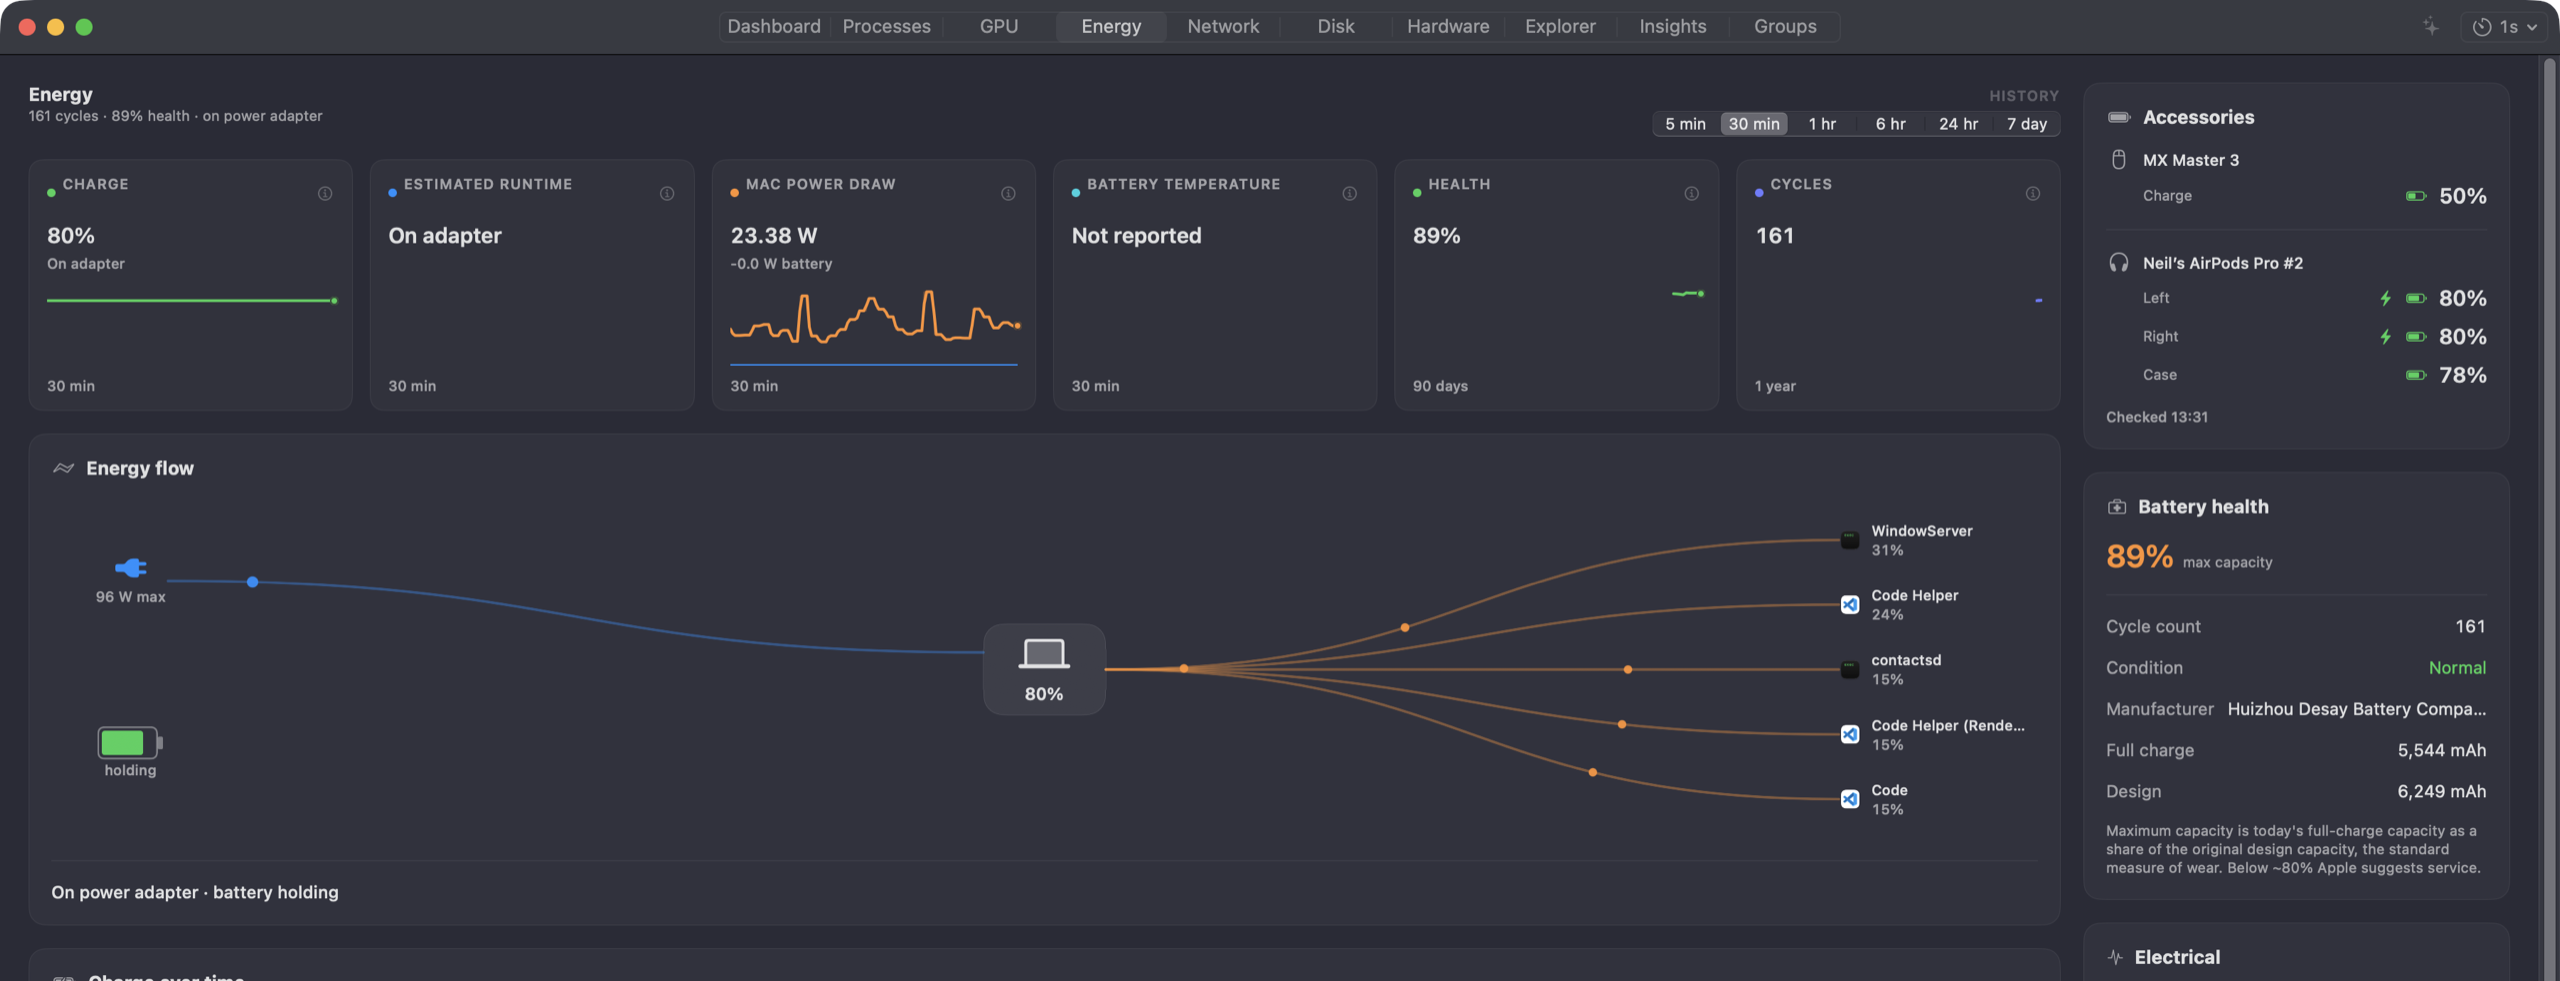
Energy: view battery health, charge, power flow, temperatures, fans, and the processes using the most energy.
-
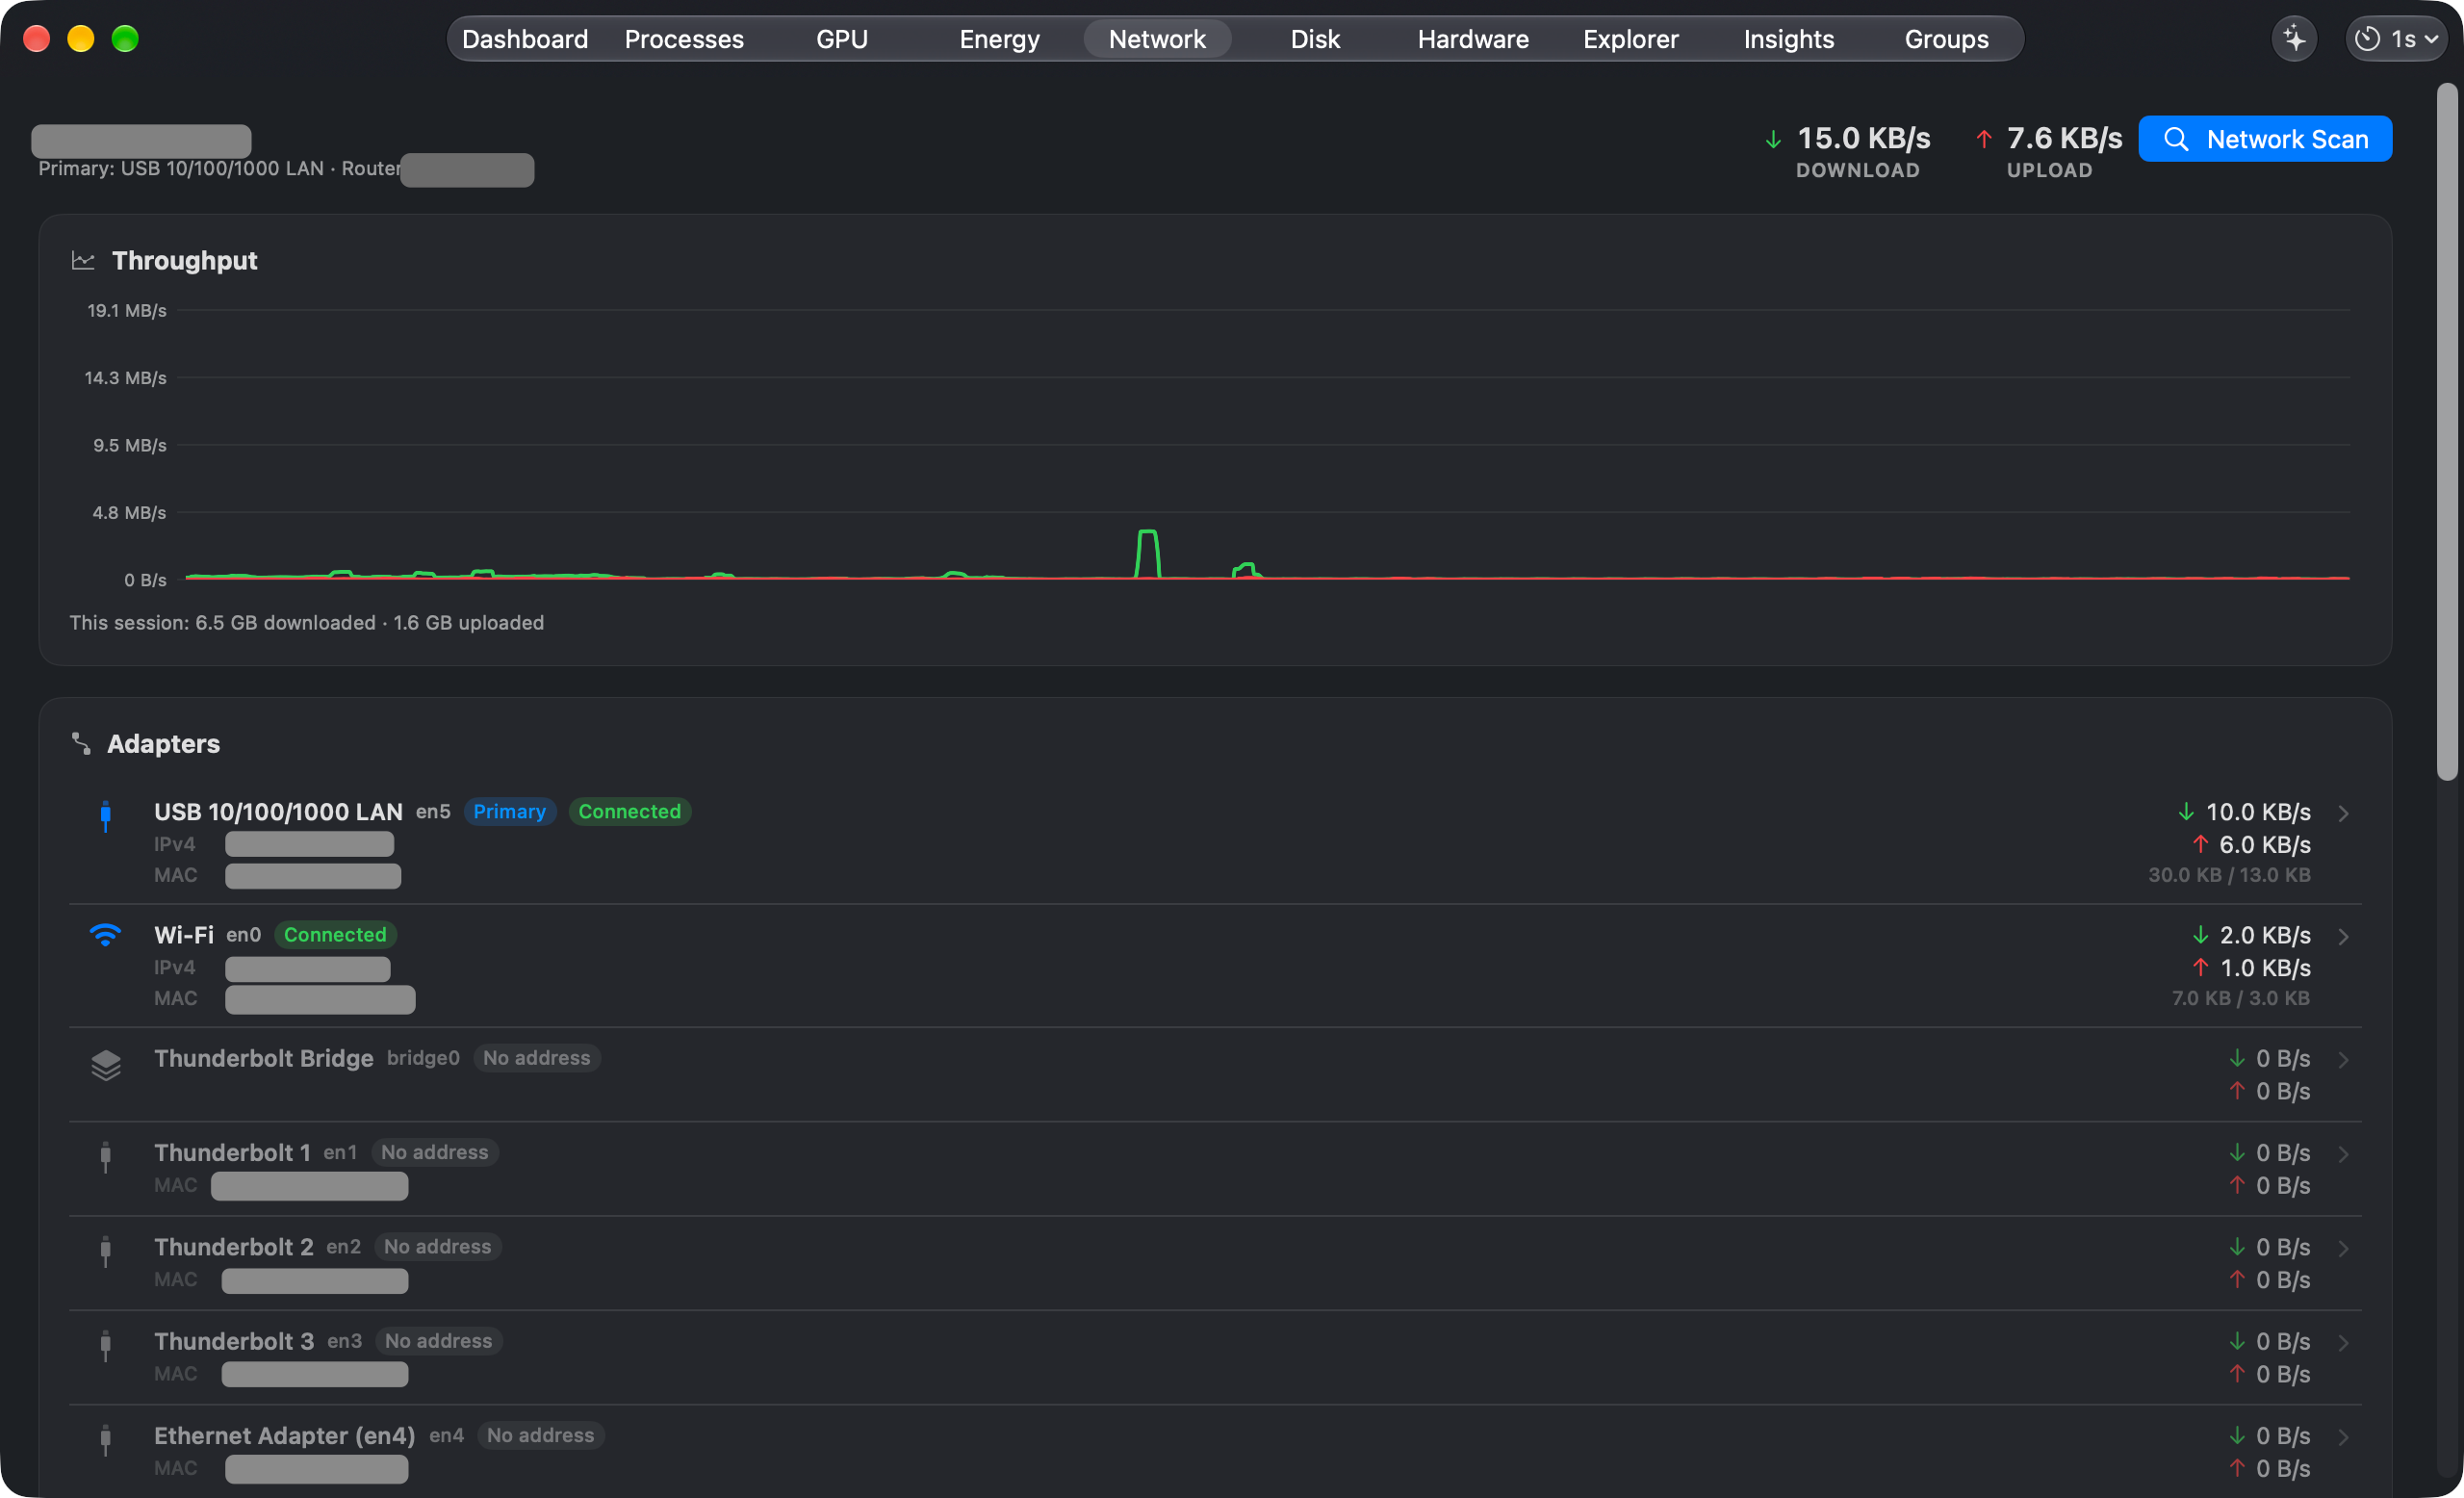
Network: follow download and upload rates, inspect adapters, and enable per-app traffic tracking to see which apps use the network.
-
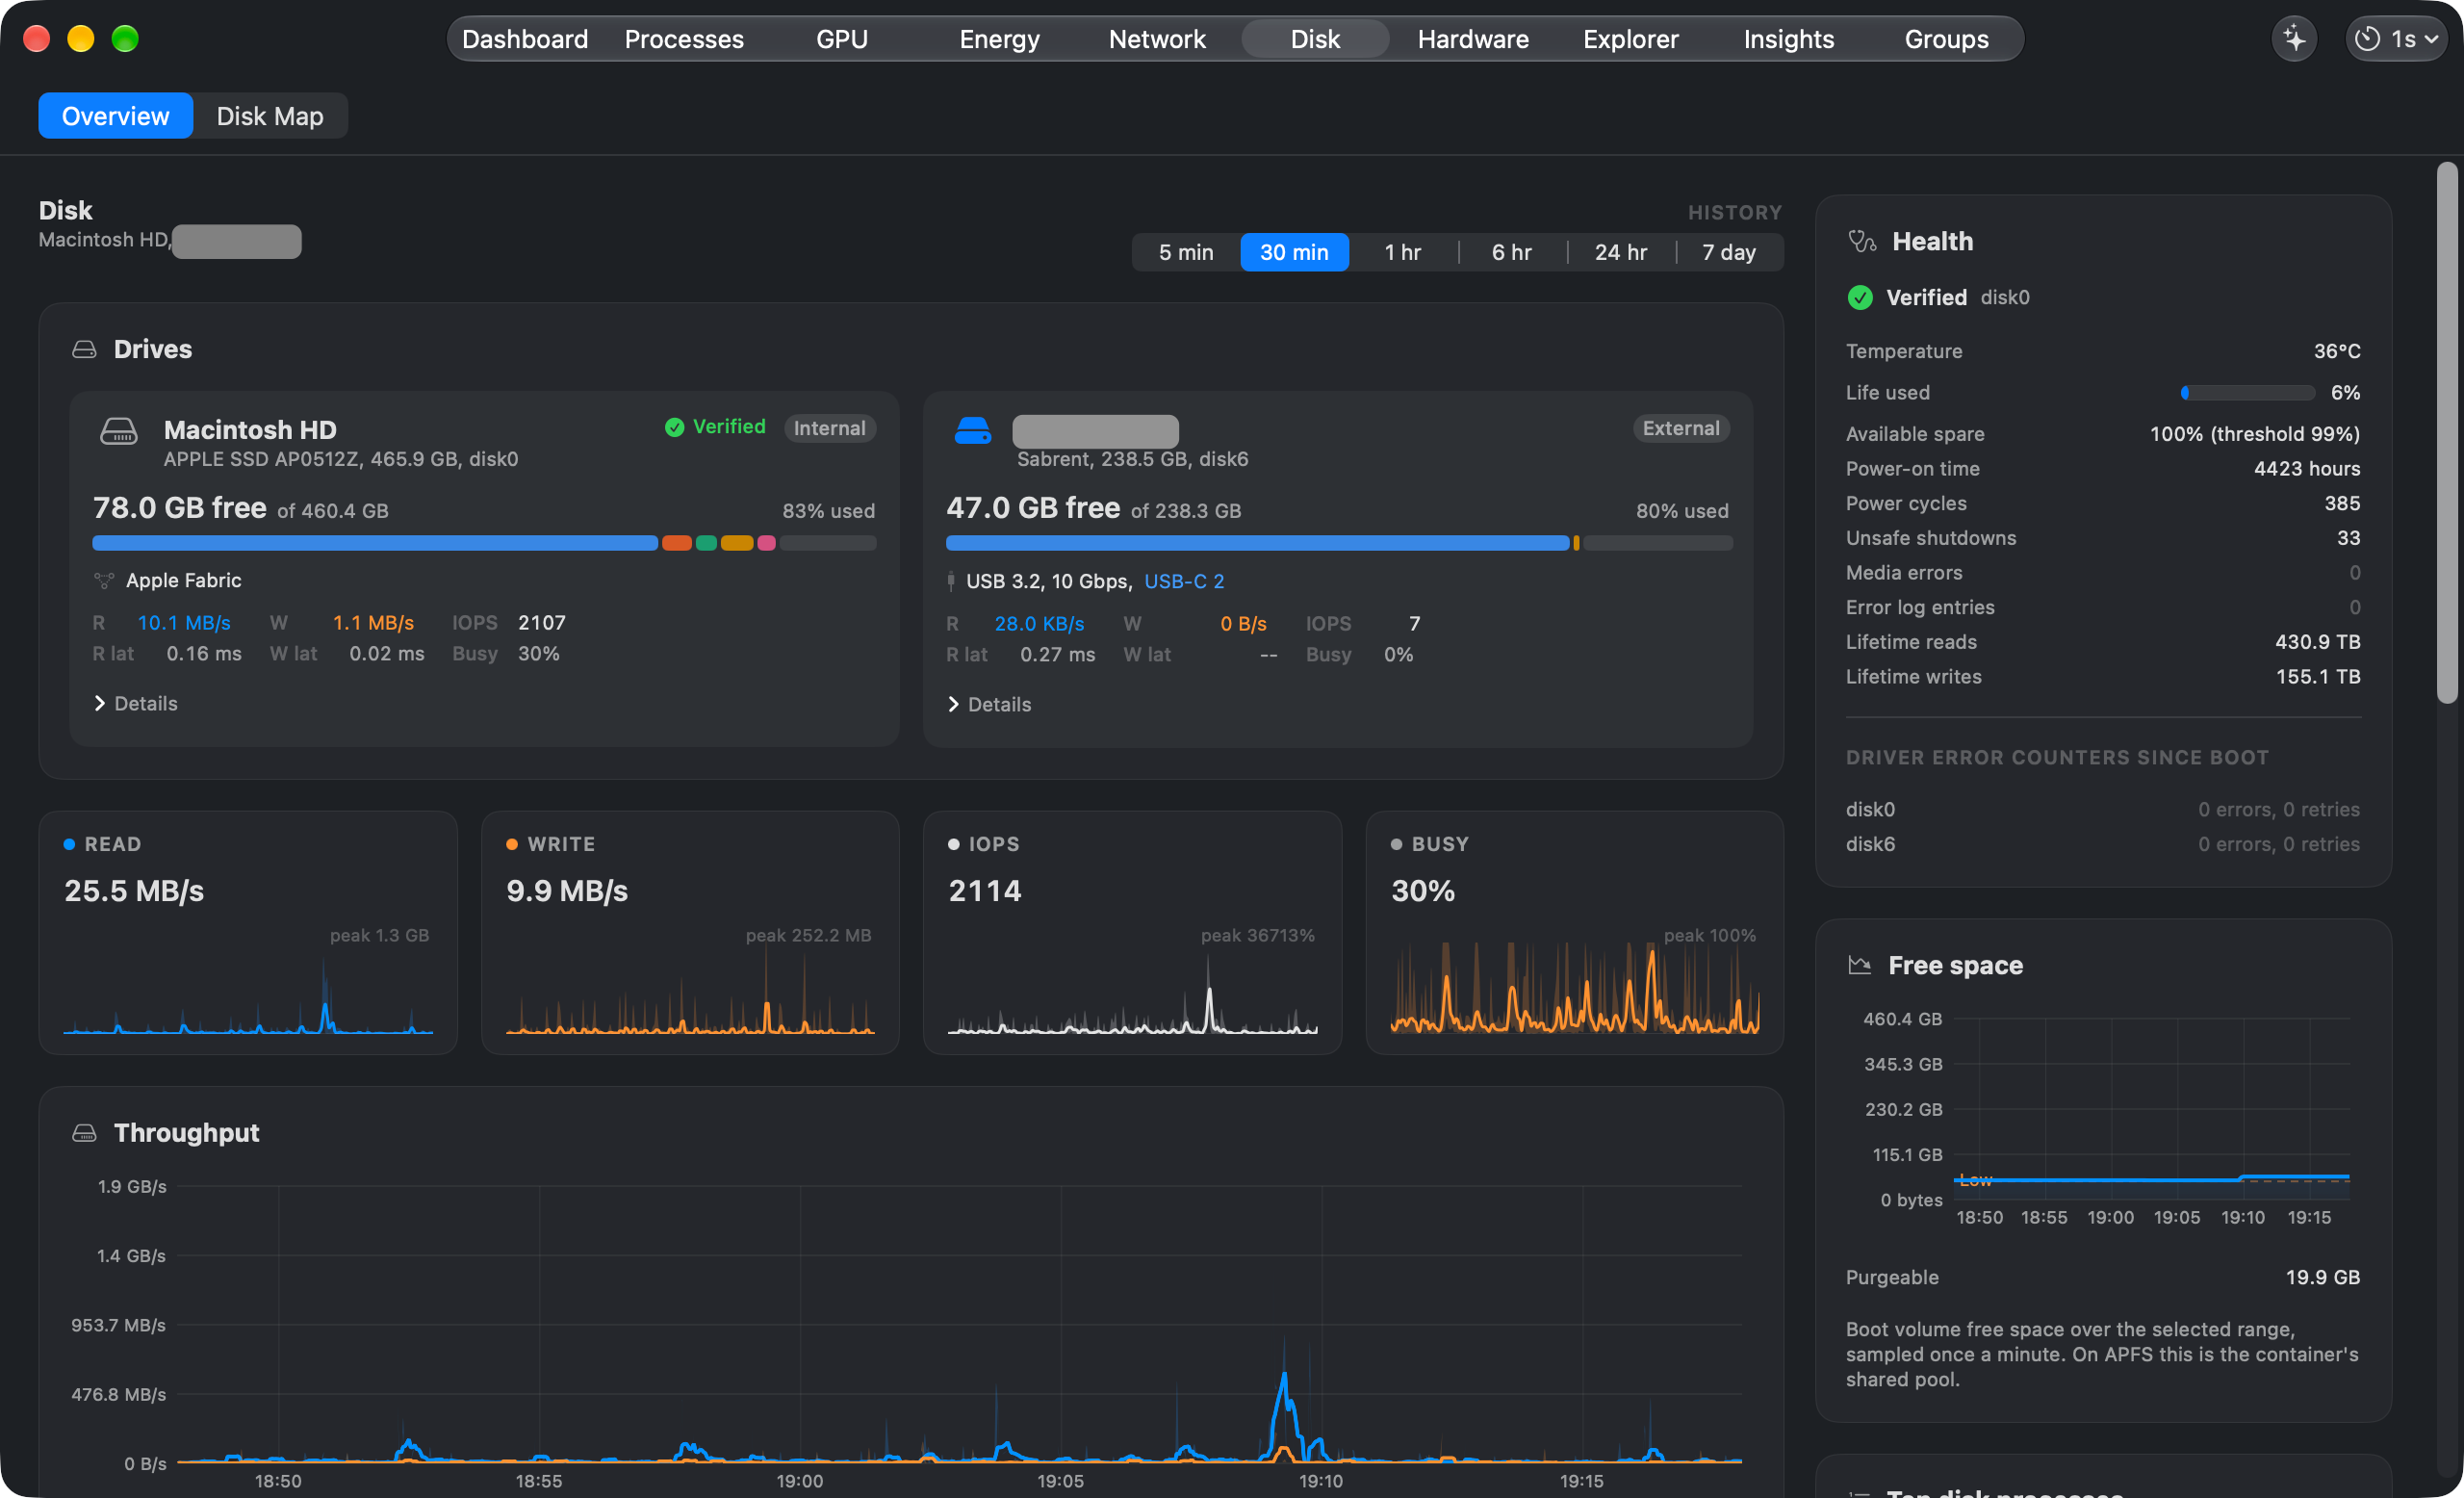
Disk: chart throughput, IOPS, and service time. Inspect drive health, volume space, and the processes doing the most I/O.
-
Disk Map: scan a disk or folder, explore its space as a treemap, and find large or old files. Reveal items in Finder or open Quick Look.
-
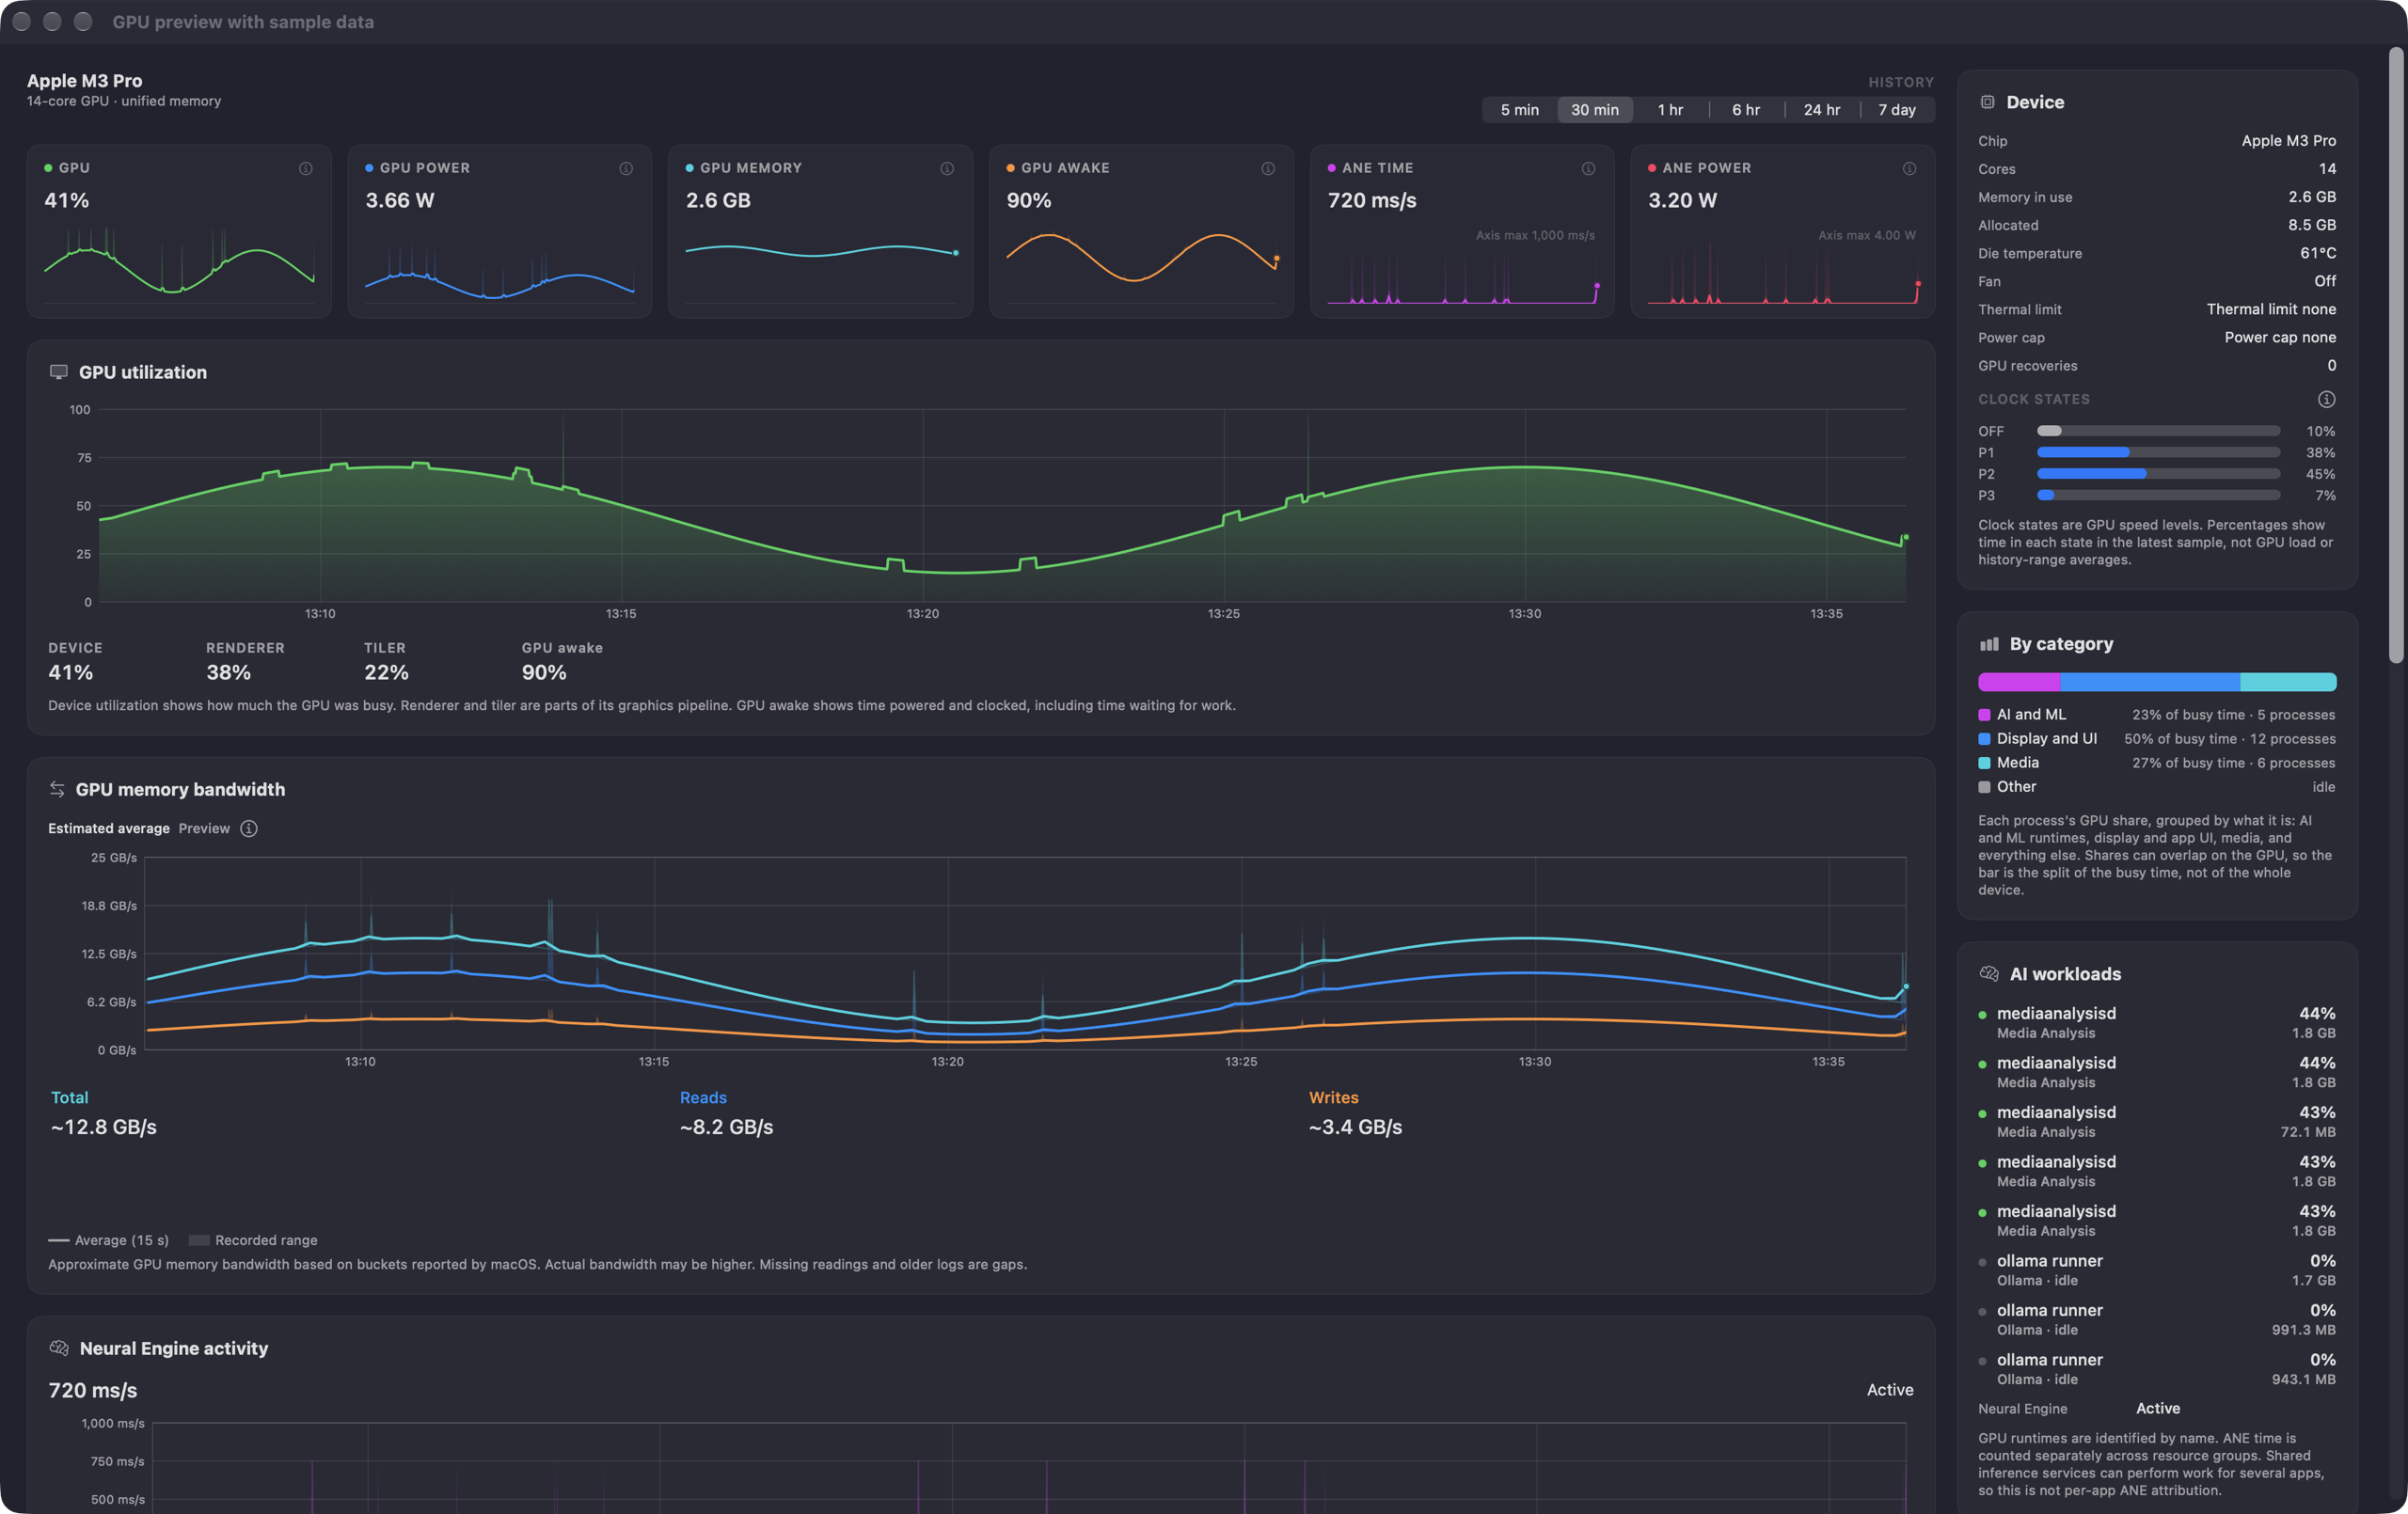
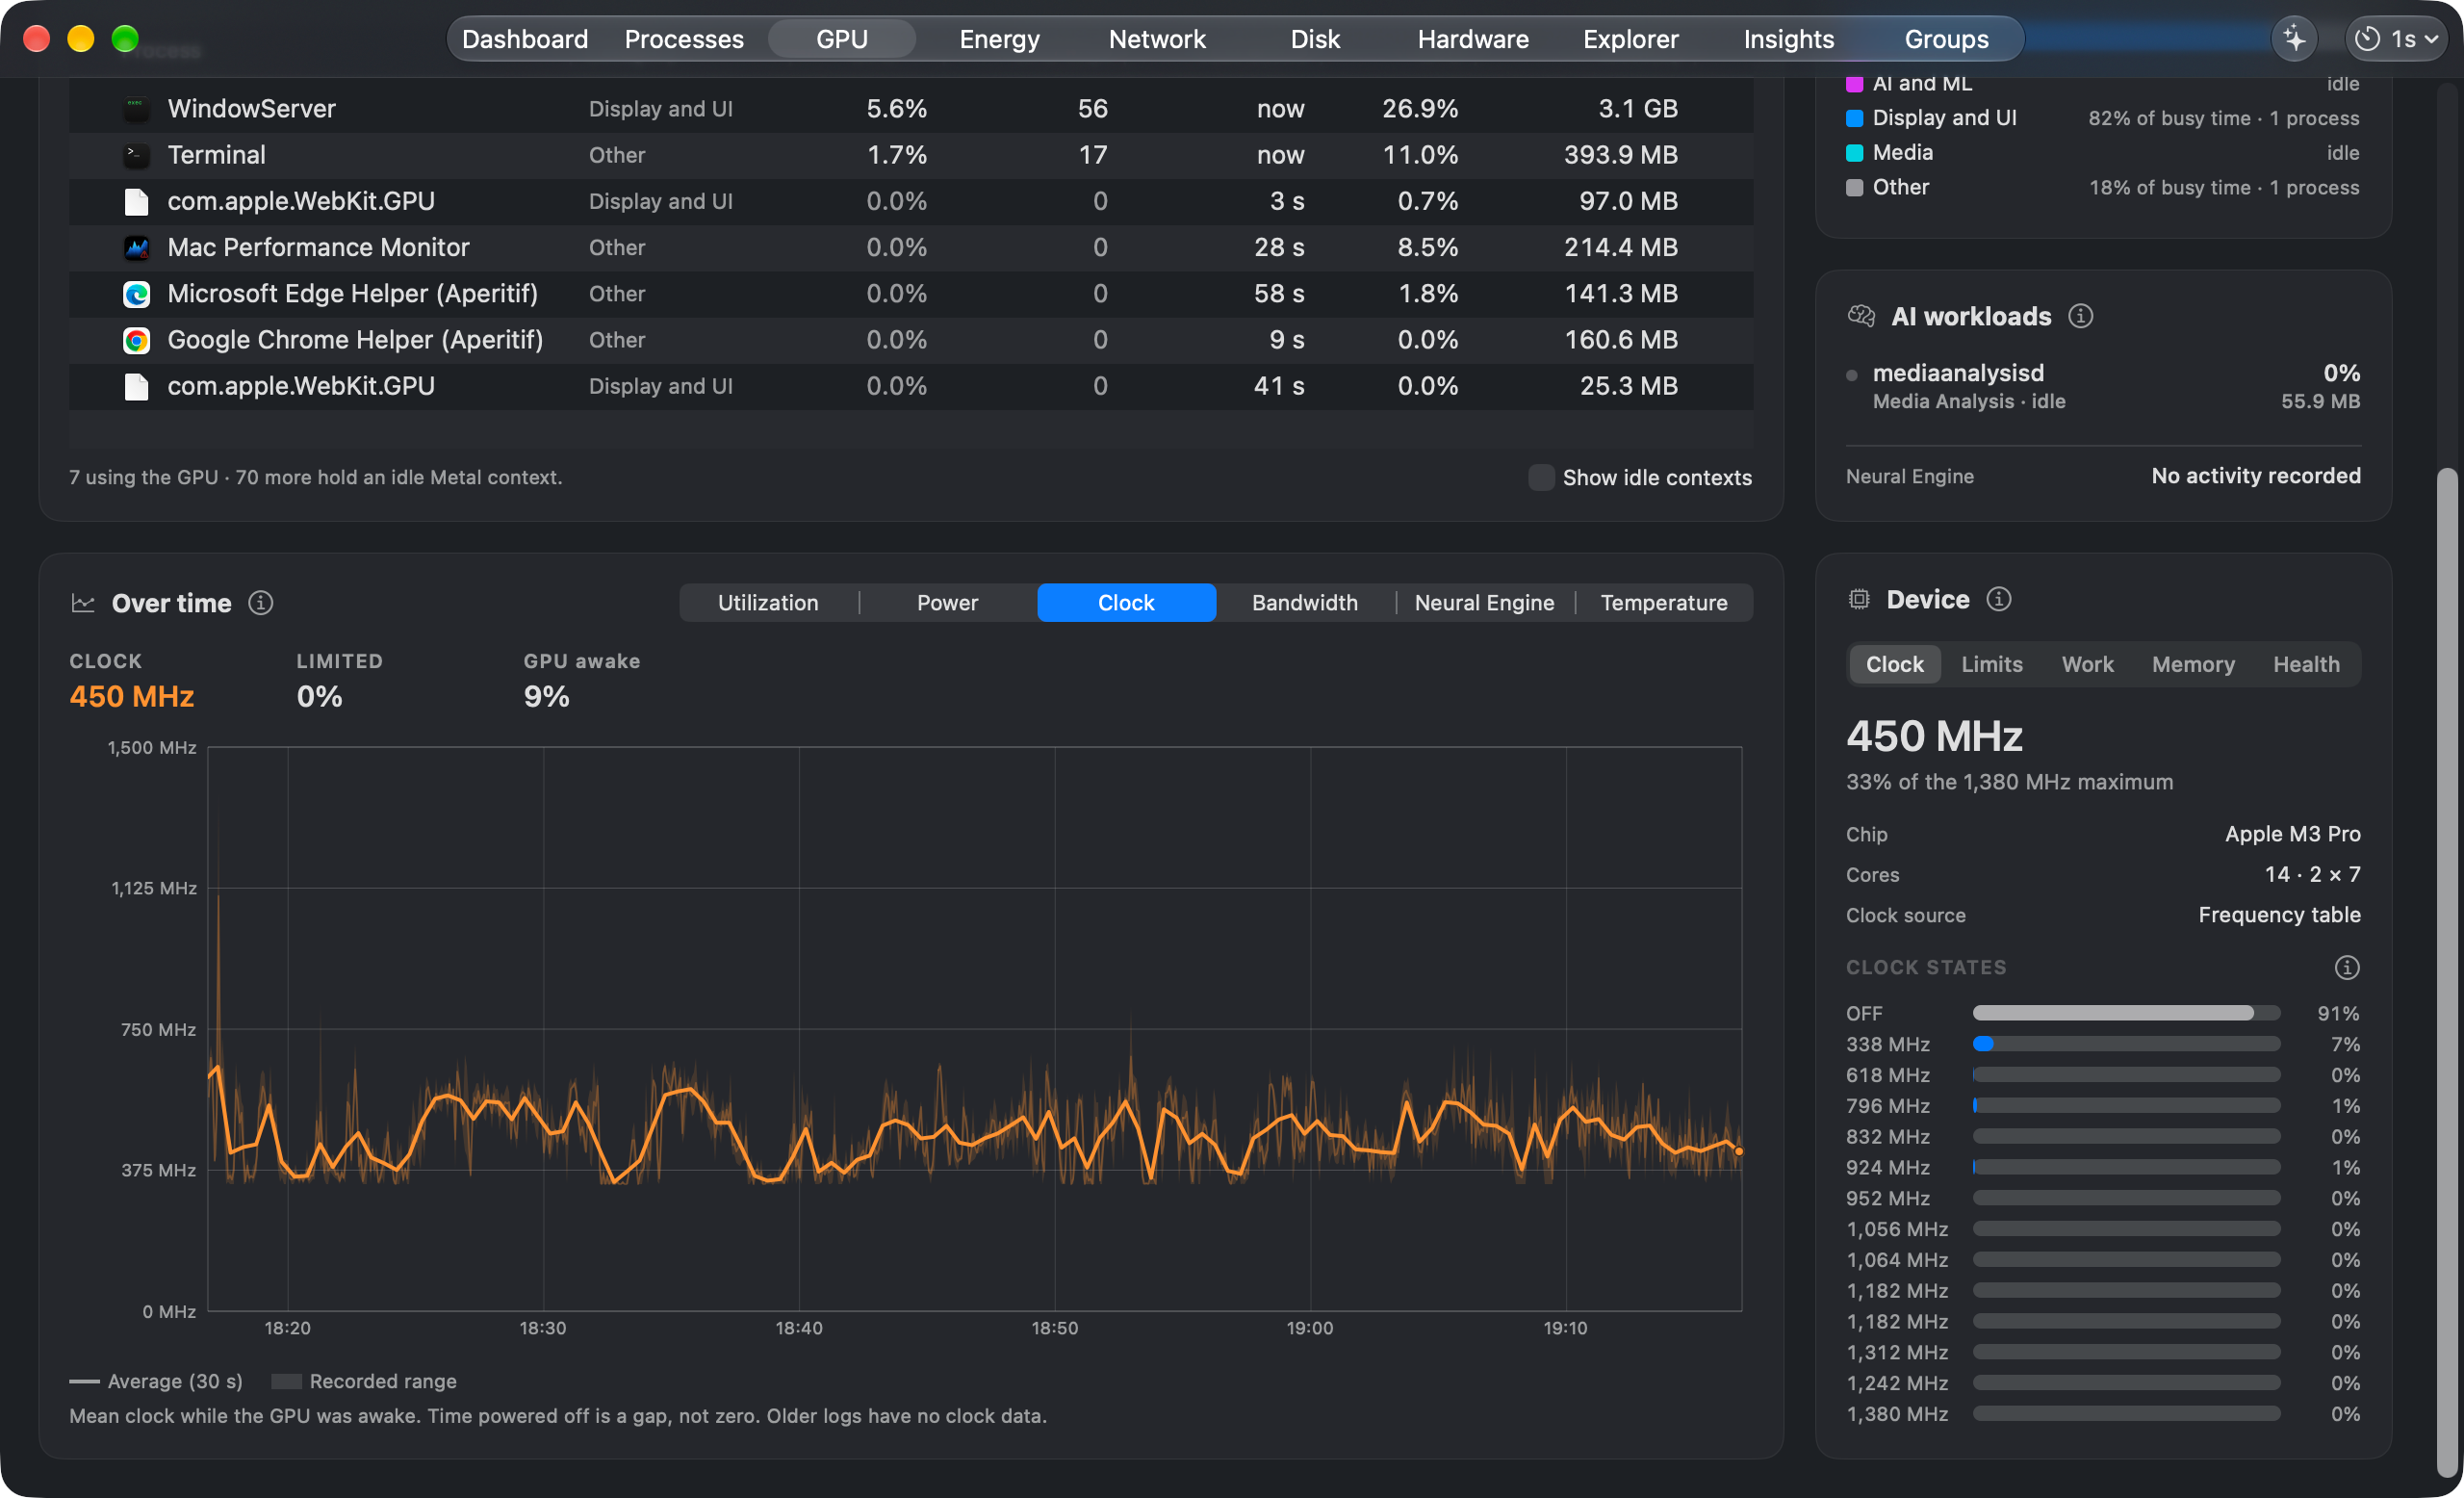
GPU: see device and per-process activity, power, memory, and thermal limits. The Device panel shows the GPU's clock and what limits it, its work mix, its wired-memory limit, and health counters such as recoveries and firmware restarts, with clock history in Over time. The bandwidth preview adds history beside separate ANE time and power, and recorded GPU memory and awake time. Recognize AI runtimes such as Ollama, MLX, and LM Studio.
-
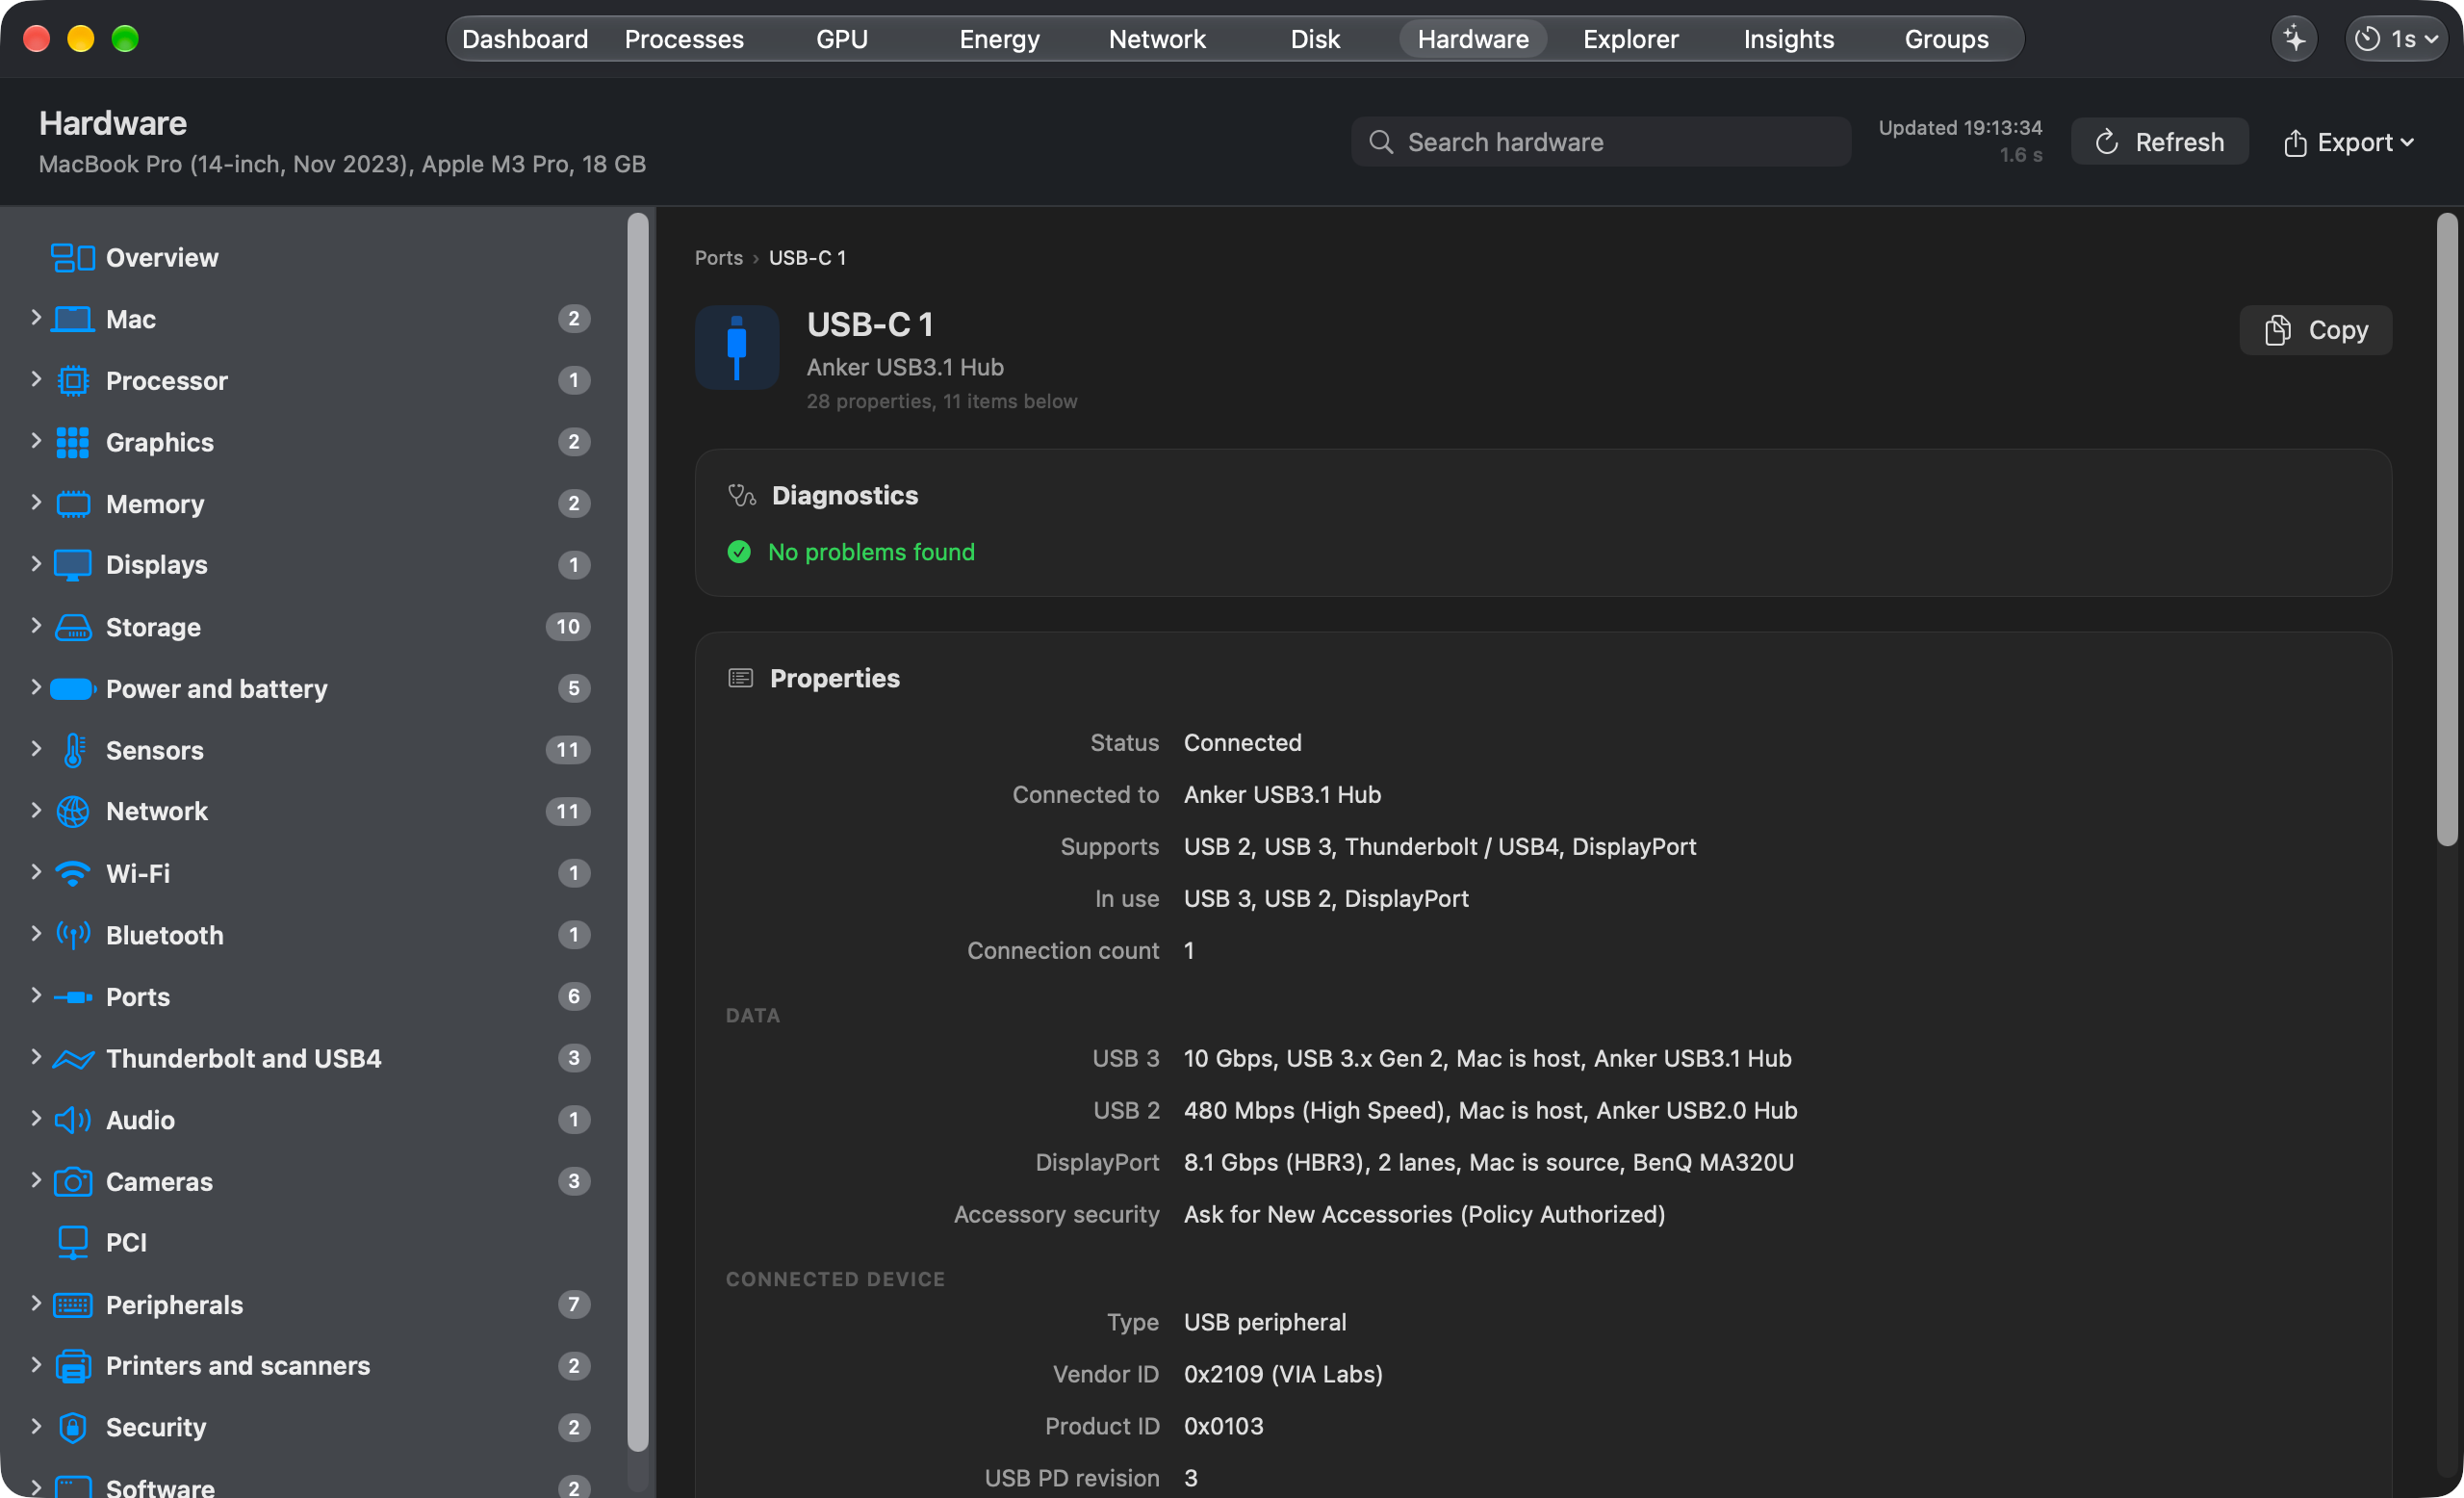
Hardware: browse a searchable inventory of the chip, memory, displays, storage, and connected devices. Refresh on demand or save a report. Ports shows each USB-C, MagSafe, HDMI and SD port: what is plugged in, the negotiated data link, the charger's offer and live draw, the cable's rating from its e-marker, and plain-language warnings such as a cable that limits charging or a USB 3 drive stuck at USB 2 speed. The USB devices on each port are listed under it, nested by hub.
-
History and diagnostics: choose recording detail and retention, find top consumers over time, and investigate processes with on-device diagnostics.
Screenshots
Every screenshot shows real readings from one MacBook Pro (M3 Pro) running the app, with no sample data. Hostnames, network and hardware addresses, serial numbers, and personal device and volume names are covered with grey boxes. Capture details are in the release checklist.
Dashboard
The current overview: pressure, memory, CPU, network, disk, and thermal trends.

Processes
The Apps layout adds up each app's memory and CPU across all of its processes. Selecting an app lists the processes working for it.
Process Usage Timeline
Sampled running history for one process over 24 hours. Apple app and media activity are optional lanes, left off here.
Ask About This Mac
On macOS 27, Ask opens with a plain status for each part of the Mac, based on the last hour.
Energy
Charge, power draw, battery health and cycles, accessory batteries, and the processes drawing the most power.
GPU
Live GPU, power, memory, awake time and Neural Engine readings, with the processes using the GPU and what kind of work they do.
The Device panel shows the GPU's clock against its top clock and time at each clock state, with the clock recorded in Over time.
Network
Throughput history and each network adapter.
Disk
A card for each drive with free space, connection, and live reads and writes, beside the internal drive's health.
Hardware Ports
Each port shows what is plugged in, the negotiated data links, and plain diagnostics.
Install
For the latest published build, download MacPerformanceMonitor.pkg from
Releases
and double-click it. Published packages are Developer ID signed and notarized
by Apple. Sparkle handles app updates.
Homebrew
brew install --cask mac-performance-monitor
This installs the same signed, notarized pkg from the main
homebrew-cask repository. Homebrew's
version can lag a new release until its cask update lands. The app also keeps
itself current through Sparkle.
To include it in brew upgrade, pass --greedy.
Build From Source
git clone --branch main https://github.com/Zesty0wl/mac-performance-monitor.git
cd mac-performance-monitor
swift build
swift test
Scripts/run.sh
You need Apple silicon and macOS 15 (Sequoia) or later. Building the app
bundle needs Xcode 27 for its App Intents metadata and the macOS 27 SDK. Core
builds and tests use Swift 6. Bundling needs Xcode's xcstringstool too.
The run script uses a signing identity when available, or falls back to ad-hoc
signing. Ad-hoc builds cannot use the privileged helper. See
CONTRIBUTING.md for signing options and test coverage.
Privacy
No usage telemetry or analytics. Recorded performance data and alert evidence stay on your Mac. Exports leave it only when you choose to share them.
Update checks, signed check and glossary downloads, and network tools make network requests. They do not upload your recorded performance history. Ask uses Apple's on-device model and clears its conversation when closed. If you hand an investigation to an AI agent such as Claude Code, the agent sends what it reads to its provider. Optional Siri and Shortcuts sharing follows Apple's processing rules and can pass results to other actions. See Security and privacy for these separate choices.
Contributing
Contributions are welcome. See CONTRIBUTING.md and the Code of Conduct. Security reports go through SECURITY.md.
The app ships in English, Simplified Chinese, German, French, and Russian. German, French, and Russian began as AI translations and await review by native speakers. New 2.0 strings in Simplified Chinese also include generated copy awaiting review. Translate or review in your browser on Crowdin, or edit one file and open a pull request. See TRANSLATING.md for the translation history and review process.
License
Released under the MIT License. Bundles GRDB.swift (MIT) and Sparkle (MIT).