
graphic-walker
An open source alternative to Tableau. Embeddable visual analytic
Automatically checked · GitHub checked 2026-11-16
Overview
 English |
Graphic Walker






Graphic Walker is a different open-source alternative to Tableau. It allows data scientists to analyze data and visualize patterns with simple drag-and-drop / natural language query operations.
Why is it different?
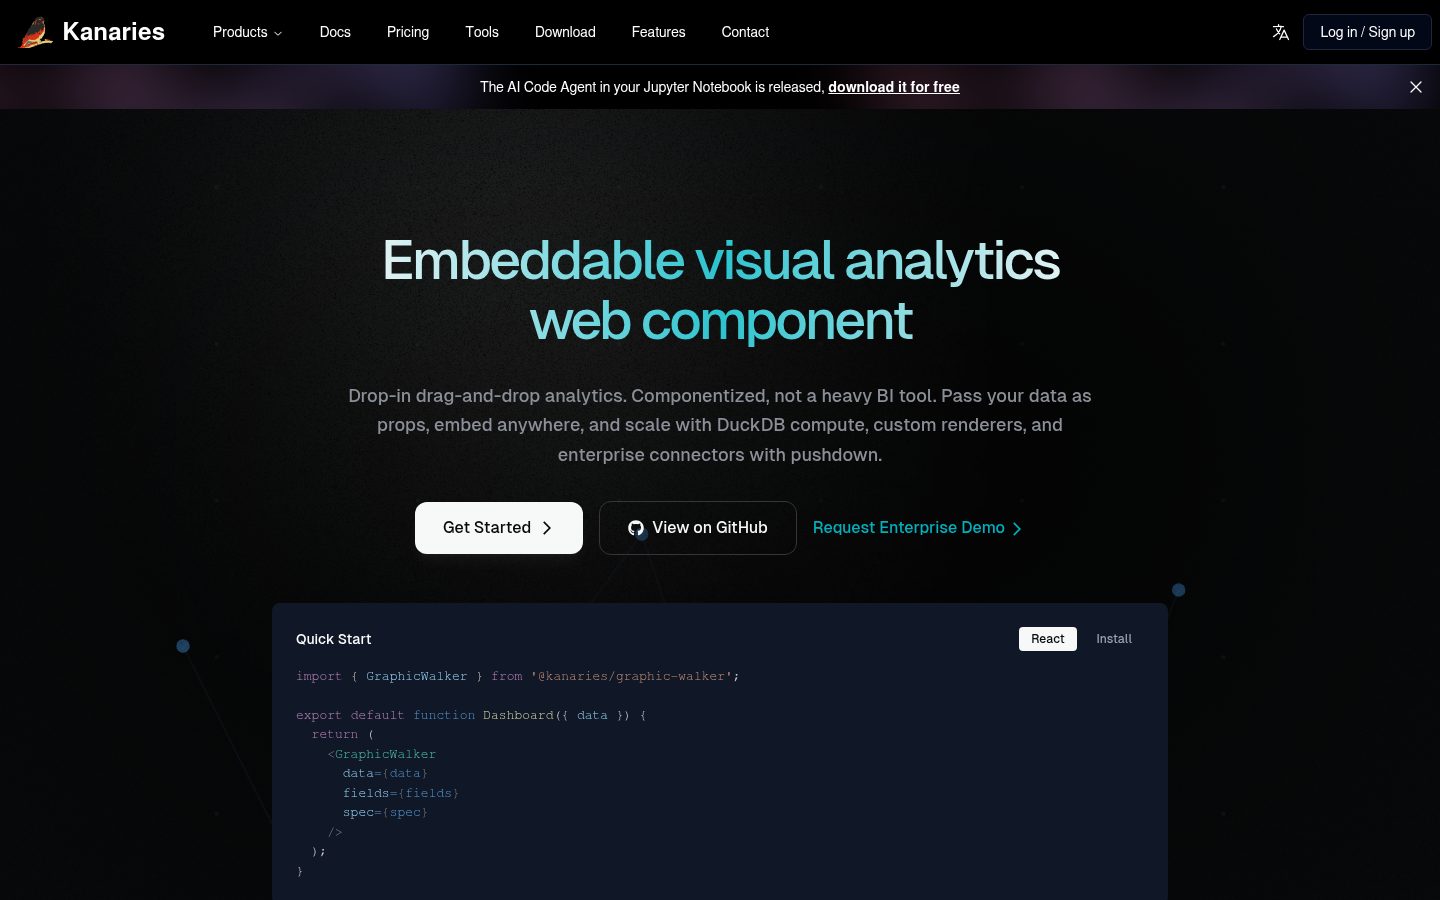
It is extremely easy to embed in your apps just as a React component 🎉! The original purpose of graphic-walker is not to be a heavy BI platform, but a easy to embed, lite, plugin.
Main features
- A user friendly drag and drop based interaction for exploratory data analysis with visualizations.
- A Data Explainer which explains why some patterns occur / what may cause them (like salesforce einstein).
- Using web workers to handle computational tasks which allow you to use it as a pure front-end app.
- A general query interface for submit data queries to your own computation service. You can have a look at how we using DuckDB to handle data queries in PyGWalker
- Light Theme / Dark Theme! 🤩
- Spatial visualization. (supports GeoJSON, TopoJSON)
- Natural language / Chat interface. Ask question about your data!
- A grammar of graphics based visual analytic user interface where users can build visualizations from low-level visual channel encodings. (based on vega-lite)
- A hand-writable chart spec (TerseSpec): describe charts with field names and
agg(field)shorthand, then expand withnormalize(). See TerseSpec. 🆕
Usage for end users
Open the online playground to explore your data without writing code. The examples below follow the Bike Sharing dataset from an initial chart to trends, comparisons, and deeper investigation.
Load and check your data
Click Create Dataset, drop in a CSV or JSON file, or choose a sample dataset. Review the preview, then click Use This Dataset.
Open the Data tab to inspect the underlying rows. Column headers summarize category frequencies and numeric distributions. Use the column controls to review field types. Dimensions group your data; measures are values you can aggregate. This example shows the Students' Performance sample.
Build a chart with drag and drop
In Visualization, drag month onto X-Axis and registered onto Y-Axis. Set the measure's aggregation to mean to compare average hourly rentals across months. The bars show how registered riders' usage changes through the year.
You can also select fields and choose a chart from Auto Viz. Hold Ctrl or Cmd to select multiple fields. Add fields to Color, Size, or Details for more context, and use Filters to focus on a subset of the data.
Follow trends and compare groups
Switch to a line chart, put hour on X, and add workingday to Color. Registered riders have distinct morning and evening peaks on working days, while non-working days have a broader daytime peak. In this sample, 1 means a working day and 0 means a non-working day.
Compare multiple measures
Add casual alongside registered on Y to give each measure its own panel. This area view shows both measures by hour, stacked by day type. Each measure uses its own numeric range, so check the axes when comparing magnitudes between panels.
Explore relationships with facets
To compare casual and registered rentals directly, use a scatter plot with casual on X and registered on Y. Turn off aggregation to show individual records. Place workingday before casual on X to split the chart into two panels, and use season for color.
The same axes across panels make the different relationships on working and non-working days easier to see.
Add more levels with nested worksheets
The default Worksheet renderer supports multiple dimensions on both axes. The screenshot at the top of this README shows season → workingday → daytime nested on rows, with year and two measures on columns. That puts morning and afternoon usage, day type, season, and year in one view while keeping registered and casual rentals separate.
Reorder fields to change the hierarchy. Use shared scales to compare facets, or configure independent X and Y scales when you need separate ranges. Headers and axes remain visible while larger worksheets scroll.
Investigate a mark with Explain Data
Click a mark and choose Interpret Data to investigate it. Here, January's average registered rentals are lower than those of most other months.
Explain Data lets you inspect extreme values, contributing dimensions and measures, and what is unusual about the selected mark. Select a finding to view its supporting comparison. These are statistical clues to investigate, not proof of causation.
Save and return to your analysis
Use + New to explore another question in a separate chart. Click Save As File to keep your dataset and charts, then use Import Graphic Walker File to reopen them later. You can also export a worksheet as an image or export its data. Worksheet exports include content outside the visible scroll area.
Deploy, Usage for Developers
If you want to use Graphic Walker as a data exploration tool without thinking about deployment details, you can use our online out-of-the-box version.
Use it here: Graphic Walker Online
Examples here: Graphic Walker Examples
Method 1: use as an independent app.
yarn install

yarn workspace @kanaries/graphic-walker build
Method 2: Use as an embedding component module 🔥
Using graphic walker can be extremely easy. It provides a single React component which allows you to easily embed it in your app.
yarn add @kanaries/graphic-walker

# or

npm i --save @kanaries/graphic-walker
In your app:
import { GraphicWalker } from '@kanaries/graphic-walker';

const YourEmbeddingApp: React.FC<IYourEmbeddingAppProps> = props => {
    const { data, fields } = props;
    return <GraphicWalker
        data={data}
        fields={fields}
        chart={graphicWalkerSpec}
        i18nLang={langStore.lang}
        defaultTab="data"
    />;
}

export default YourEmbeddingApp;
Use defaultUIConfig to set the editor's initial UI state. For example, start with the Auto Viz panel collapsed:
<GraphicWalker
    data={data}
    fields={fields}
    defaultUIConfig={{
        panels: {
            autoViz: { expanded: false },
        },
    }}
/>
The collapsed panel can still be opened with its expand button or the Auto Viz toolbar toggle. Omitting panels.autoViz.expanded keeps the panel expanded by default.
UI defaults apply only when the visualization store is created. Updating defaultUIConfig, supplying a new spec or chart, or switching charts does not reset the user's panel state. A reused keepAlive store also retains its state. Use defaultConfig for chart configuration and layout defaults, and defaultTab for the initial tab.
If you have a configuration of GraphicWalker chart, you can use the PureRenderer or GraphicRenderer component to make a single chart without controls UI.
import { PureRenderer } from '@kanaries/graphic-walker';

const YourChart: React.FC<IYourChartProps> = props => {
    const { rawData, visualState, visualConfig, visualLayout } = props;
    return <PureRenderer
        rawData={rawData}
        visualState={visualState}
        visualConfig={visualConfig}
        visualLayout={visualLayout}
    />;
}

export default YourChart;
The GraphicRenderer component accepts same props as GraphicWalker, and would display the chart and the filters of the chart to change.
import { GraphicRenderer } from '@kanaries/graphic-walker';

const YourChart: React.FC<IYourChartProps> = props => {
    const { data, fields, spec } = props;
    return <GraphicRenderer
        data={data}
        fields={fields}
        chart={spec}
    />;
}

export default YourChart;
You can use TableWalker component to make a single table view with your data. it accepts same props as GraphicWalker, but you don't need to pass the chart prop, and you can control the page size by pageSize prop(default value is 20).
import { TableWalker } from '@kanaries/graphic-walker';

const YourChart: React.FC<IYourChartProps> = props => {
    const { data, fields, spec } = props;
    return <TableWalker
        data={data}
        fields={fields}
        pageSize={50}
    />;
}

export default YourChart;
TerseSpec: write charts by hand 🆕
Charts in Graphic Walker are stored in a canonical spec format (IChart) that is verbose and machine-oriented: fields carry generated ids, and every channel, pool and layout knob is explicit. TerseSpec is a hand-writable authoring grammar on top of it — you reference fields by name, and normalize() expands the terse spec into a full canonical chart that any component accepts:
import { GraphicRenderer, normalize } from '@kanaries/graphic-walker';

const YourChart = ({ data, fields }) => {
    const chart = normalize(
        {
            mark: 'bar',
            x: 'Manufacturer',
            y: 'mean(Price_in_thousands)',
            color: 'Vehicle_type',
        },
        fields
    );
    return <GraphicRenderer data={data} fields={fields} chart={[chart]} />;
};
The grammar at a glance:
| Syntax | Meaning |
|---|---|
"x": "Manufacturer" | reference a field by name |
"y": "mean(Price_in_thousands)" | aggregation shorthand: sum / mean / count / median / min / max / variance / stdev |
"x": "fid:col_0_64" | fid: prefix bypasses name resolution |
{ "field", "aggregate", "sort", "timeUnit" } | object form for per-channel options; timeUnit performs a real query-level date drill |
"computed": [{ "name", "expr" | "bin" | "log" }] | inline computed fields; quote refs inside expr like '"Horsepower" / "Curb_weight"' |
"filters": [{ "field", "oneOf" | "notIn" | "range" | "timeRange" }] | row filters; timeRange takes epoch milliseconds |
"aggregate": false / "stack" / "limit" / "sort" | chart-level knobs |
"config" / "layout" | canonical escape hatches, merged last with the highest priority |
normalize(input, fields) is a unified entry: besides TerseSpec it also accepts canonical charts, partial charts, legacy persisted specs and Vega-Lite-like specs, always returning a complete canonical IChart (stamped with $schema) and validating computed-field references along the way — an unknown field name fails fast with nearest-candidate suggestions.
TerseSpec is authoring-only. Persistence and export/import keep using the canonical format, so nothing changes for previously saved charts.
👉 Try the interactive grammar lessons in the playground, read the full contract in docs/terse-spec-design.md, or validate against the JSON Schema at https://graphic-walker.kanaries.net/tersespec_v1.json.
try local (dev mode)
# packages/graphic-walker
npm run dev
Share with Open Source Community
Please consider sharing your experience or thoughts about graphic walker with the border Open Source community If you like this project.





AI Integration
https://github.com/Kanaries/graphic-walker/assets/22167673/15d34bed-9ccc-42da-a2f4-9859ea36fa65
[!TIP] If you want more AI features, we also build runcell, an AI Code Agent in Jupyter that understands your code/data/cells and generate code, execute cells and take actions for you. It can be used in jupyter lab with
pip install runcell
I18n Support
Graphic Walker now support English (as "en" or "en-US") , Japanese (as "ja" or "ja-JP") , Chinese (as "zh" or "zh-CN") with built-in locale resources. You can simply provide a valid string value (enumerated above) as props.i18nLang to set a language or synchronize your global i18n language with the component like the following example:
const YourApp = props => {
    // ...

    const curLang = /* get your i18n language */;

    return <GraphicWalker
        data={data}
        fields={fields}
        i18nLang={curLang}
    />
}
Customize I18n
If you need i18n support to cover languages not supported currently, or to totally rewrite the content of any built-in resource(s), you can also provide your resource(s) as props.i18nResources to Graphic Walker like this.
const yourResources = {
    'de-DE': {
        'key': 'value',
        ...
    },
    'fr-FR': {
        ...
    },
};

const YourApp = props => {
    // ...

    const curLang = /* get your i18n language */;

    return <GraphicWalker
        data={data}
        fields={fields}
        i18nLang={curLang}
        i18nResources={yourResources}
    />
}
Graphic Walker uses react-i18next to support i18n, which is based on i18next, so your translation resources should follow this format. You can simply fork and edit /locales/en-US.json to start your translation.
It is recommended to use chatGPT-i18n to translate to your target languages.
API
Graphic Walker Props & Ref interface
Props
export interface IGWProps {
	data?: IRow[];
	fields?: IMutField[];
	spec?: Specification;
	i18nLang?: string;
	i18nResources?: { [lang: string]: Record<string, string | any> };
	keepAlive?: boolean | string;
    fieldKeyGuard?: boolean;
    vizThemeConfig?: IThemeKey;
    apperence?: IDarkMode;
    storeRef?: React.RefObject<IGlobalStore | null>;
    computation?: IComputationConfig;
    toolbar?: {
        extra?: ToolbarItemProps[];
        exclude?: string[];
    };
    uiTheme?: IUIThemeConfig;
}
data: optional { Array<{[key: string]: any}> }
Array of key-value object data. Provide this prop with fields prop together.
fields: optional { IMutField }
Array of fields(columns) of the data. Provide this prop with data prop together.
spec: optional { Specification }
spec: optional { Specification }Visualization specification. This is an internal prop, you should not provide this prop directly. If you want to control the visualization specification, you can use storeRef prop. To describe charts programmatically, prefer TerseSpec + normalize() with the chart prop.
i18nLang: optional { string = 'en-US' }
Graphic Walker support i18n, you can set the language of the component by this prop. Currently, we support en-US, zh-CN, ja-JP with built-in locale resources. If you want to use other languages, you can provide your own locale resources by i18nResources prop.
i18nResources: optional { { [lang: string]: Record<string, string | any> } }
Customize locale resources. See Customize I18n for more details.
keepAlive: optional { boolean | string = false }
Whether to keep the component state when it is unmounted. If provided, after you unmount the graphic-walker component, the state will still be stored, and will be restored when the component is mount again. If you need to enable keepAlive for multiple graphic-walker components, you can provide a unique string value for each component to distinguish them.
vizThemeConfig: optional { IThemeKey = "vega" }
Specify the chart theme to use.
appearance: optional { IDarkMode = "media" }
Specify the dark mode preference. There're three valid values:
"media": Use the system dark mode preference."dark": Always use dark mode."light": Always use light mode.
storeRef: optional { React.RefObject<IGlobalStore | null> }
If you want to control the visualization specification, you can provide a React.RefObject<IGlobalStore | null> to this prop. The IGlobalStore is the combined store context of Graphic Walker, you can use it to control the visualization specification.
computation: optional { IComputationFunction }
Specify the computation configuration. See Computation for more details.
- Client-side computation (default)
Provide noting to use client-side computation. In this mode, the computation will be done in the browser (mainly use WebWorker).
- Server-side computation
Graphic Walker will call given computation function with IDataQueryPayload as parameter.
The function should returns a IRow[] as result.
When you are using Server-side computation, you should provide fields together.
toolbar: optional { ToolbarProps }
Customize the toolbar.
scales: optional { IChannelScales }
Customize the scale of color, opacity, and size channel. see Vega Docs for available color schemes.
Here are some examples:
// use a another color pattren
const channelScales = {
    color: {
        scheme: "tableau10"
    }
}
// use a diffrent color pattren in dark mode and light mode
const channelScales = {
    color({theme}) {
        if(theme === 'dark') {
            return {
                scheme: 'darkblue'
            }
        }else {
            return {
                scheme: 'lightmulti'
            }
        }
    }
}
// use a custom color palette
const channelScales = {
    color: {
        range: ['red', 'blue', '#000000']
    }
}
// customing opacity
const channelScales = {
    // map value of 0 - 255 to opacity 0 - 1
    opacity: {
        range: [0, 1],
        domain: [0, 255],
    }
}
// set min radius for arc chart
const channelScales = {
    radius: {
        rangeMin: 20
    }
}
uiTheme: optional { IUIThemeConfig } (beta stage)
Specify the color that graphic walker use, so the background of Graphic Walker will match to your website.
currently in beta stage, the parameter may change in the future.
You can pass either css color name (such as cyan), tailwind color name (such as zinc-900), hex color (e.g. #ff0000), hsl color (e.g. hsl(217.2 91.2% 59.8%)), or hwb color(e.g. hwb(60, 3%, 60%)).
you can also use helpers to help you create a color config.
Here are some examples:
import { getColorConfigFromPalette, getPaletteFromColor } from '@kanaries/graphic-walker'

const uiTheme: IUIThemeConfig = {
    light: {
        background: 'amber-100',
        foreground: 'amber-950',
        primary: 'amber-950',
        'primary-foreground': 'amber-50',
        muted: 'amber-200',
        'muted-foreground': 'amber-500',
        border: 'amber-300',
        ring: 'amber-950',
    },
    dark: {
        background: 'amber-900',
        foreground: 'amber-50',
        primary: 'amber-50',
        'primary-foreground': 'amber-800',
        muted: 'amber-700',
        'muted-foreground': 'amber-400',
        border: 'amber-700',
        ring: 'amber-300',
    },
};

import colors from 'tailwindcss/colors';
const uiTheme = getColorConfigFromPalette(colors.zinc);

const uiTheme = getColorConfigFromPalette(getPaletteFromColor('#6366f1'));

<GraphicWalker uiTheme={uiTheme} />
Ref
export interface IGWHandler {
    chartCount: number;
    chartIndex: number;
    openChart: (index: number) => void;
    get renderStatus(): IRenderStatus;
    onRenderStatusChange: (cb: (renderStatus: IRenderStatus) => void) => (() => void);
    exportChart: IExportChart;
    exportChartList: IExportChartList;
}
chartCount: { number }
Length of the "chart" tab list.
chartIndex: { number }
Current selected chart index.
openChart: { (index: number) => void }
Switches to the specified chart.
renderStatus: { IRenderStatus }
Returns the status of the current chart. It may be one of the following values:
"computing": GraphicWalker is computing the data view."rendering": GraphicWalker is rendering the chart."idle": Rendering is finished."error": An error occurs during the process above.
onRenderStatusChange: { (cb: (renderStatus: IRenderStatus) => void) => (() => void) }
Registers a callback function to listen to the status change of the current chart. It returns a dispose function to remove this callback.
exportChart: { IExportChart }
Exports the current chart.
exportChartList: { IExportChartList }
Exports all charts. It returns an async generator to iterate over all charts. For example:
for await (const chart of gwRef.current.exportChartList()) {
    console.log(chart);
}
Server integration
For those who need to integrate graphic-walker with their own databases/OLAP, you can develop based on our SDK gw-dsl-parser
which translate graphic-walker specification to SQL
What's next
Graphic Walker is basically manual data exploration software. When facing more complex datasets, manual exploration can cost a lot of time, Rath is software providing a different data analysis experience with automation enhancement.
LICENSE
Please refer to LICENSE and LICENSE2 for Kanaries logos file.